

Having previously reviewed the 803 D3 back in 2017, Bowers and Wilkins were kind enough to extend the invitation for me to review the latest generation 803 D4. I decided I would try my hand at shooting a video for this review. I hope you enjoy it.
Description:
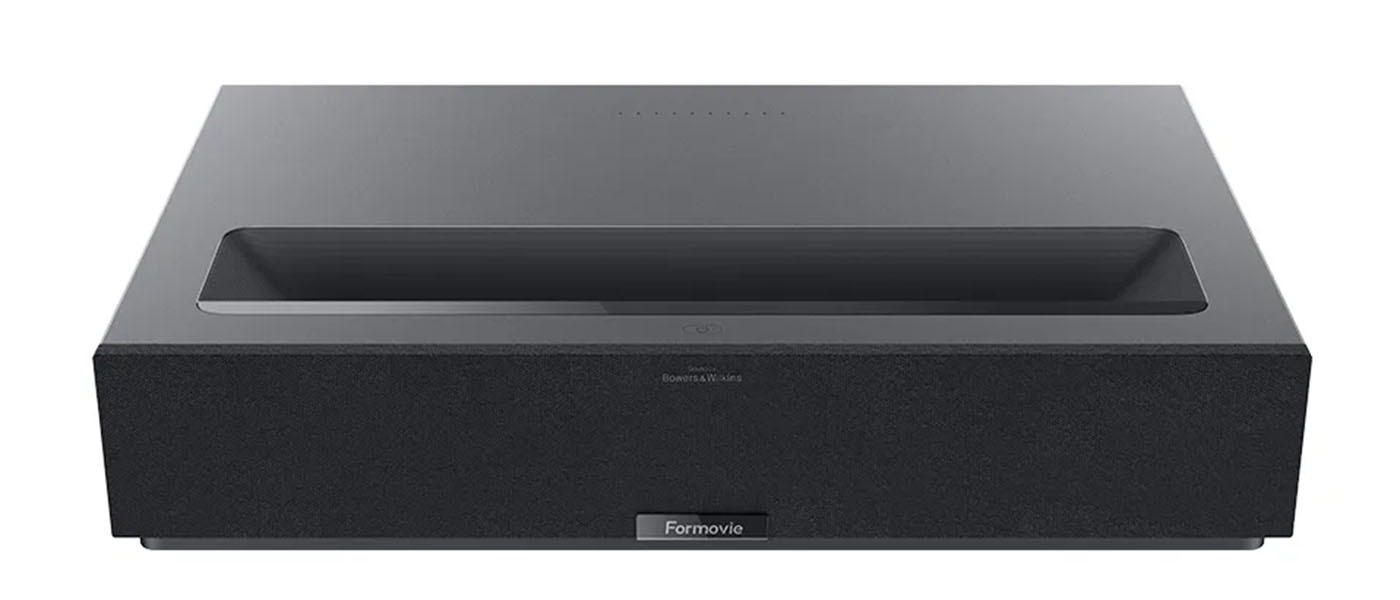
3-way, bass reflex floor-standing loudspeaker with down-firing port.
Low-Frequency Transducer:
Dual 7-inch “Aerofoil” cone bass drivers.
Midrange Frequency Transducer:
Single 5-inch “Continuum” cone FST driver.
High-Frequency Transducer:
Single 1-inch Diamond Impregnated dome tweeter.
Recommended Amplifier Power:
50 – 500 Watts RMS into 8 Ohms.
Frequency Response (Manufacturer):
19 Hz – 28 kHz +/- 3dB
Sensitivity:
90 dB (on -axis 2.83V @ 1M)
Nominal Impedance:
8 Ohm (minimum 3 Ohm)
Inputs:
Set of Four Binding Posts, Bi-Wire, and Bi-Amp Capable
Dimensions:
45.7” H x 13.1” W x 19.6” D
Weight:
137 pounds each
Finish:
Gloss Black, White, Satin Walnut, and Satin Rosenut Woodgrain Veneer.
MSRP:
$22,500.00 (pair)
Website:
Company:
SECRETS Tags:
B&W, 803, Diamond, Floor Standing Loudspeakers, Turbine, Continuum, reviews 2022, speakers reviews, loudspeaker reviews, speakers reviews 2022, loudspeaker reviews 2022
Measurements by Carlo Lo Raso, analysis by Carlo Lo Raso and David A. Rich.
Bench tests were performed with a Cross Spectrum Labs calibrated Earthworks M30 microphone connected to my computer workstation using Room EQ Wizard acoustic measurement software, a Lynx 2B professional sound card, and an M-Audio microphone preamp. On and off-axis measurements were taken with the mic at 1-meter from the center point between the tweeter and the midrange driver as the 0-degree reference point. Unlike measurements taken outdoors or in an anechoic chamber that measure a speaker in isolation (and assess straight-line engineering), in-room measurements (while certainly not perfect) give a sense of how a speaker behaves in the actual environment that it’s used and can be helpful if carefully done. Both types of measurements are valuable (a properly designed speaker in an anechoic environment tends to hold up well in an average listening space), I just find in-room measurements interesting as they help shed light on what I am hearing and why. That and I don’t own an anechoic chamber!
Impedance measurements were taken using the Dayton Audio DATS v3 loudspeaker tester and software. All measurements, unless otherwise noted, were taken in my large basement studio space.

The in-room measurement is an 18-point spatial average. A 9-point measurement was made for the right speaker and then repeated for the left speaker. Averaging both speakers is an approach that others have been using and publishing. Using data from both speakers reduces the modal response of the room by averaging the differences in the response of the two speakers from room asymmetries. The technique cannot eliminate them, however, and the response below 300Hz remains room dominated. The results show the Bowers & Wilkins 803 D4 has a controlled response through the upper bass and midrange region, from 175 Hz to about 1 kHz after which we get a slight increase in energy towards 2 kHz. In the upper midrange region, between 2 kHz and 4 kHz we see an almost 5 dB dip in the response centered at 3 kHz. Many would refer to this as the “BBC Dip”, a designed dip in the response in this region with the intent to reduce perceived harshness. Beyond this, the treble response remains strong until 10 kHz, after which a steady, gentle 5 dB decline happens to 20 kHz. The speaker’s bass performance is commendably strong with plenty of power all the way down to 20 Hz in-room, save for a narrow notch in the response centered at 60 Hz. Unlike most of the remaining measurements, this in-room average was taken in my treated home theater room. The 803 D4 was a very tricky speaker to place in my studio listening space as I was getting either great imaging and little bass or great bass but poor imaging. I couldn’t settle on a placement in that room that gave me both with this speaker. Setting them up in my medium-sized home theater room took care of that issue and gave me the balance I was looking for. All critical listening was done with the speakers there.
David Rich notes:
B&W appears to be moving further and further away from making objectively good measuring speakers after the founder John Bowers passed away in 1987. The original 801 (1980) was an engineer’s speaker. The following is from an advertisement in Audio magazine in June 1980:
“A computer-optimized, 4th-order crossover network maintains uniform sound pressure/frequency response and correct phase characteristics.”
High Fidelity magazine’s anechoic measurements (taken at CBS labs) from October 1980 are on the wrong axis below the tweeter making it hard to get at the actual performance of the speaker. Refer to page 23.
The 1987 Matrix version as measured by Stereophile shows excellent performance for its time.
Additional measurements including the NRC listening window and in-room measurements can be found in Audio Magazine November 1990 by AES Fellow D. B. Keele. Refer to page 92.
By the time the 801 and 802 Nautilus (1999) arrives, things have changed in the amplitude response. Stereophile tests the 801 Nautilus, and the measurements show a clear change from the 1987 speaker. Note especially the vertical and horizontal radiation change.
The CEA 2034 curve is found in Dr. Floyd Toole’s book – Sound Reproduction 3rd edition on page 131, figure b. The predicted in-room response shows the large dip centered at 2kHz, but the top-end push is not yet applied in 1999.
The Pierre Aubert Spinorama site gives a very similar-looking curve as seen in Dr. Toole’s book. The source is not identified.
The 2016 B&W 802 D3 Diamond shows continued degradation in the measured performance in the Stereophile measurements. Note the tweeter level is now increased and is not flat.

To illustrate what I was talking about, this is a plot that compares the in-room responses of the Bowers & Wilkins 803 D4 in both rooms. The yellow plot shows the speaker’s response in my studio space, while the green plot is the response in my home theater room. David Rich likes to call my studio room the “bass-eating room” and you can see that clearly happening here. Also, notice how close the responses track each other from the midrange region all the way up.
David Rich notes:
The most interesting thing is between 300Hz – 600Hz. This is above the room-dominated frequency band although this is not a sharp cutoff. It does indicate differences in reflections between the rooms. Most likely the floor reflections within the theater room with thick carpet on a thick mat. We need to do this with other speakers to get a better idea about this difference.

This is a plot of the 803 D4’s average in-room response in my home theater with Anthem’s ARC room correction applied from 600 Hz on down to help refine the bass response in-room. In hindsight, 600 Hz was most likely an unnecessarily high correction limit in this room. I could have probably used a maximum limit of 250 Hz and still been just fine.

This is a plot of the NRC listening window for the Bowers & Wilkins 803 D4 scaled from 300 Hz on up which is averaged from the following measurements: 0-degree on-axis, +-15-degrees vertical, and +-15-degrees horizontal. This is the portion of the frequency range that is dominated by the speaker (response below 300 Hz tends to be dominated by the room and can vary greatly).
David Rich notes:
As we shall see when we move to the radiation patterns, the dip centered around 2kHz never changes. It is some kind of filter introduced by B&W during the 90s. The push on the tweeter appears to be an idea from this decade.

This is a plot of the CEA-2034A listening window for the Bowers & Wilkins 803 D4 scaled from 300 Hz on up which is averaged from the following measurements: 0-degree on-axis, +-10-degrees vertical, +-10-degrees, and +- 20-degrees horizontal. This is the portion of the frequency range that is dominated by the speaker (response below 300 Hz tends to be dominated by the room and can vary greatly).
David Rich notes:
Here the 2kHz dip is a little deeper and the high-end push extends to a lower frequency. It’s hard to explain this since the vertical angles in the average have been reduced and the angles over the horizontal plane have been increased to +/- 30 degrees.

Above are the horizontal radiation curves of the Bowers & Wilkins 803 D4 from 0 to 30 degrees, scaled from 300 Hz on up, measured in-room.
David Rich notes:
Looking at single-shot measurements and not the average show diamonds may not be a speaker’s best friend with the rough response from the tweeter. Even with a 30-degree offset, the top end is not flat although it is moving down. As we move off-axis, the 6.5-inch midrange is becoming more directional which is why the hole is growing bigger below the crossover.
After the midrange–tweeter crossover, the response crunches up since the tweeter is not directional until we move to higher frequencies. The tweeter is out in space not in a waveguide, so this is the expected result.

Above are the horizontal radiation curves of the Bowers & Wilkins 803 D4 from 45 to 90 degrees, scaled from 300 Hz on up, measured in-room.

Moving to the vertical radiation pattern for positive angles, we see the plots for 0 to +20 degrees, scaled from 300 Hz on up, measured in-room.

Moving to the vertical radiation pattern for negative angles, we see the plots for 0 to -20 degrees, scaled from 300 Hz on up, measured in-room.
David Rich notes:
Going down things get much worse. One could point to the good news that one likely listens seated at a higher position, but the wider negative angles are coming back to the ear from the floor bounce.
Note how the maxima of the dip moves up with an increasing negative angle. We would not expect this if the notch was due to midrange–tweeter physical displacement resulting in a cancelation at the crossover point.
I can come up with only one reason; the speaker has evolved from its 1980 performance to what we have here. More people purchase this version than the original.
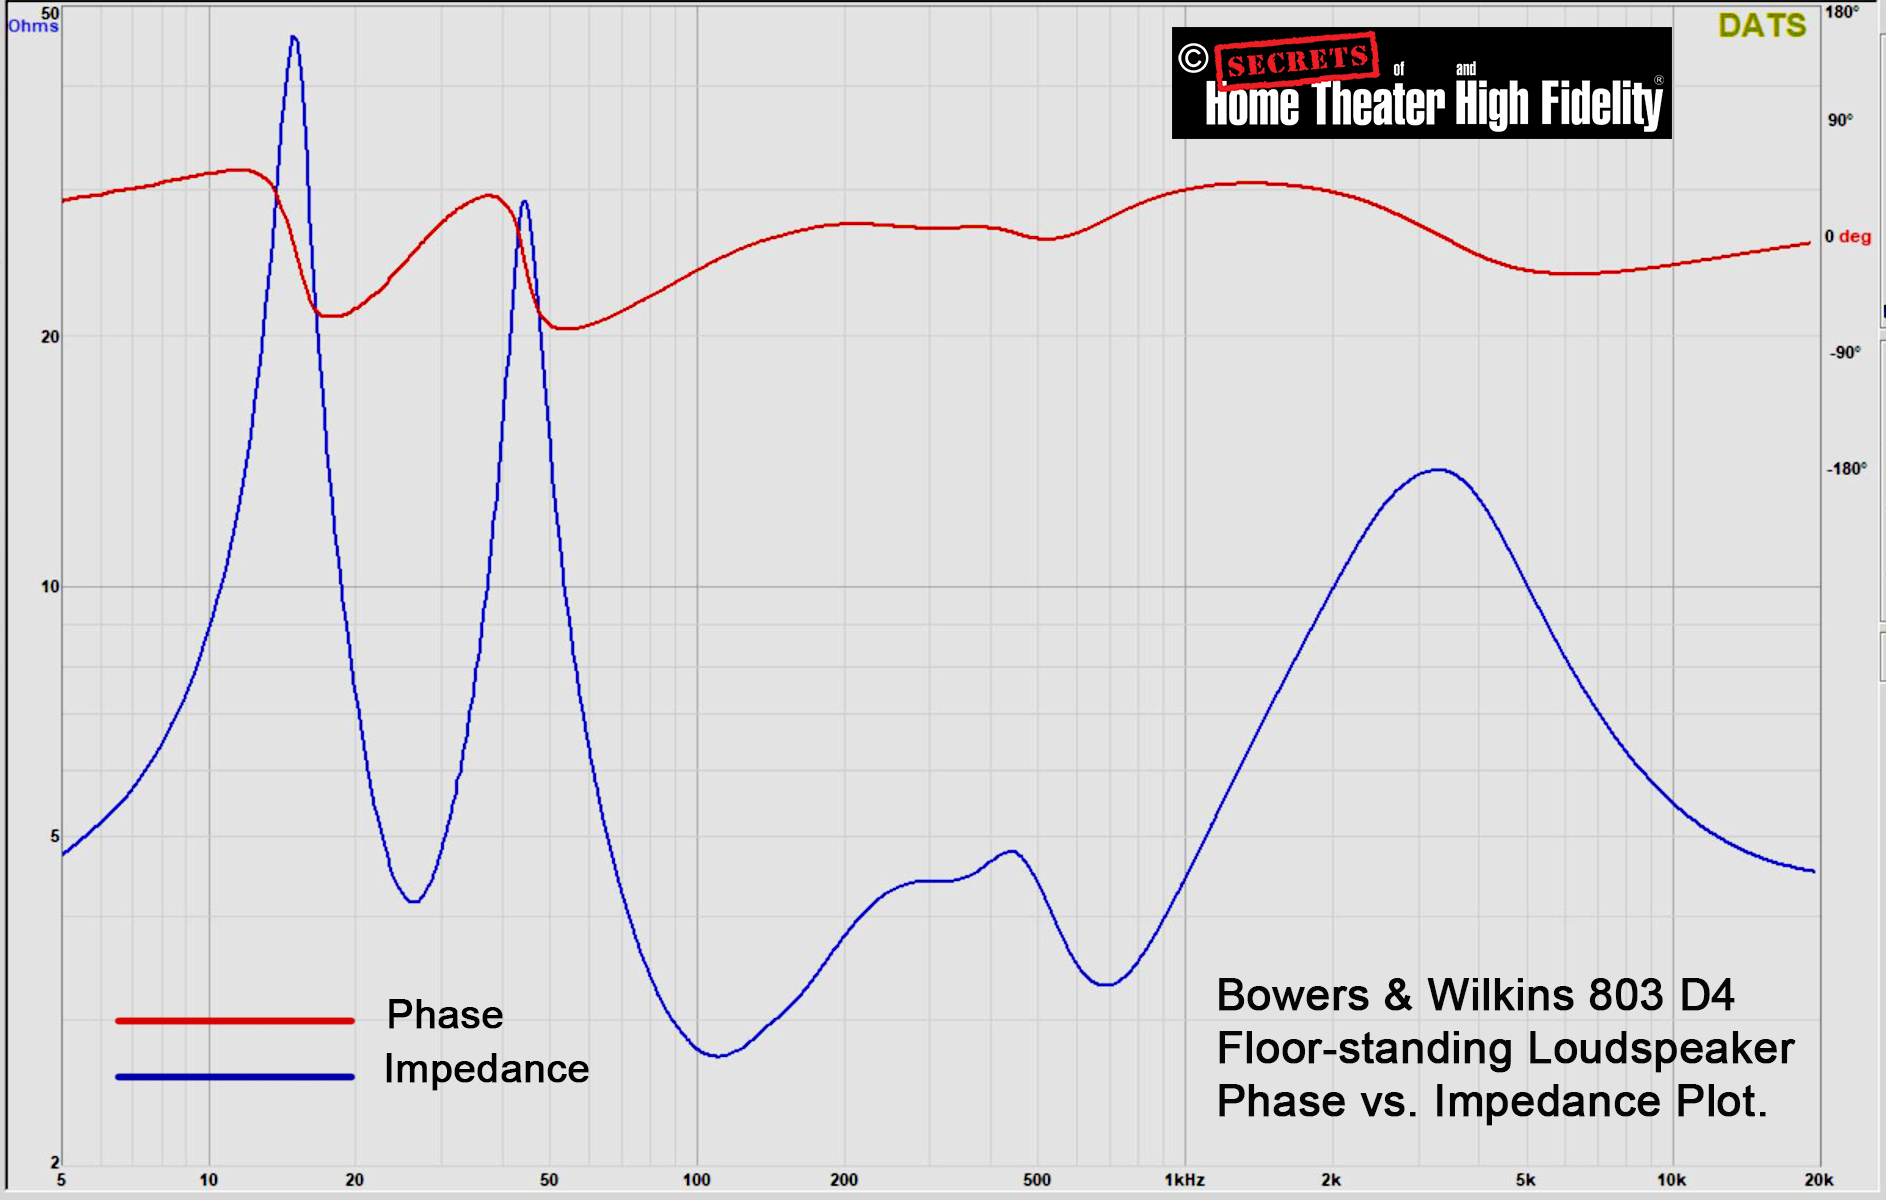
Here we have the Impedance sweep for the Bowers & Wilkins 803 D4. The results show that the speaker remains below 5-Ohms from 70 Hz to 1 kHz, above the 10 kHz level, and at 27 Hz. Through the rest of the speaker’s range, with a peak as high as 45-Ohms at 17 Hz and 30-Ohms at 55 Hz, the speaker’s impedance stays well above 8-Ohms. Calling the 803 D4 a nominal 6 to 8-Ohm Impedance speaker looks to be accurate.
The author would like to thank David A. Rich for his invaluable assistance.