
Although perhaps few of you have the means or wherewithal to calibrate your own display device, going through the motions with us and learning how the SDR process differs from HDR is going to give you a deeper understanding of our new frontier.
We’ll be using the latest version of SpectraCal’s CalMAN software.
To start, let us turn our attention back to SDR for a bit.
Calibrating a display for SDR is, conceptually at least, rather straight forward. We have a very well defined standard. Peak white should be 100 nits (or thereabouts). Black should be 0 (or as close as the technology will allow), and everything in between needs to follow the old gamma or power curve, while maintaining the correct neutral color balance of D65 (aka Lawful Neutral in D&D parlance). Of course realizing this is largely incumbent on the TV itself in terms of how well it is designed and manufactured, and how much adjustment capabilities are actually made available.
This is not meant to be a lesson in how to calibrate a TV, but the process goes something like this…
The first step is to address pre-sets and “enhancements”, in general turning off anything which sounds like marketing bull crap. “Auto flesh tone”, anything with the word “enhancement” or “reduction” attached to it, and so on. Then we take a basic walk through setting Brightness, Contrast, Color, Hue, and Sharpness. If you are interested in the particulars, Spears & Munsil have an excellent set of collegiate essays on all of these, Spears & Munsil.
Then comes the fun part, that of displaying test signals and measuring the output of the display (not every step of the process will be shown here).

Calibration Options
Here we establish what it is exactly that we want to calibrate to. In this example we are doing an SDR HDTV, so rec.709 will be our color space, whitepoint will be the eternal and oh so sacred D65, and for Gamma we are using the more progressive BT.1886 EOTF which is akin to yesteryears 2.4 power curve but with a specially designed offset (for more detail please see the excellent paper from SpectraCal).

Pre-calibration Report
Next we take a series of readings which enumerates for us where the display is at right now. This is mainly so that at the end we can appreciate how much of an improvement we have achieved, but even now it is useful to scan it and see what we are going to need to work on. At top left is the RGB Balance graph which is actually expressing two related but distinct parameters. As we go from pure black on the left to peak white on the right, we are seeing the relative balance of Red, Green, and Blue as well as the overall output level deviation. For example, we can see that at an input signal level of 40 there is not enough green and blue which not only is creating a grayscale issue, but also means the output is a little low as well.
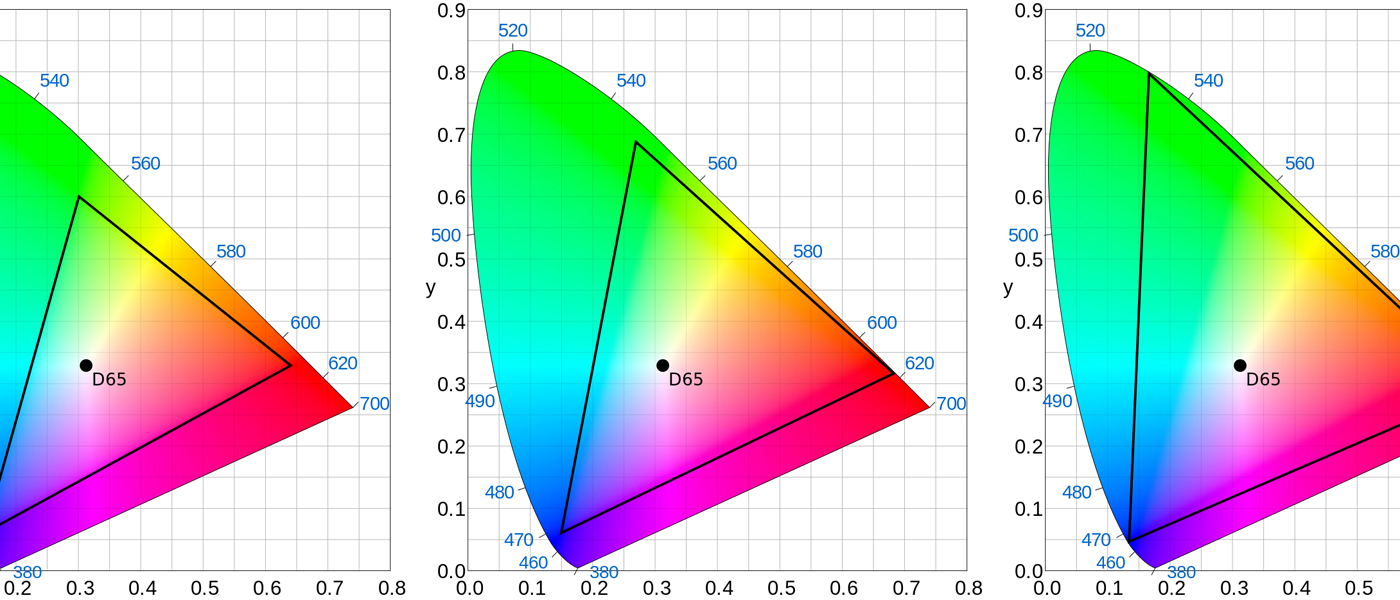
To the right of that is the color gamut chart which you should now recognize. The triangle denotes BT.709 color space and the dots are how close the display is to getting the color correct (they should fall right inside the small white squares at the corners and edges.)
Finally, there are the two DeltaE 2000 charts, one for grayscale/gamma, and the other for gamut. In layman’s terms this is a metric for how far off base the image is at the various luminance or saturation points. We want to see an error of no more than 3, and ideally less than 1. Less than 1 is considered imperceptible to human vision.

Grayscale Two Point
After a few more checks (white clipping and so on which we won’t get into) we typically do a two-point greyscale adjustment. We look at the RGB balance at signal levels of 30 and 100, or sometimes 30 and 80, and if available adjust the display’s RGB cuts and drives controls (also called bias and gain among many other euphemisms). On many displays these are the only controls offered. In this example we can see at a glance that at the low end we are almost perfect, at the high we can surely do better.

Grayscale and Gamma Multipoint Adjustment
Next we look at grayscale and gamma in more detail, taking readings at signal levels of 0 through 100%, incrementing by no more than 10, or in the above screen shot by 5. In this example we can see that the display has some pretty significant issues not only with grayscale, but gamma as well. The RGB graph shows us the display is running a little darker than it should (most of the RGB lines are below 0). The Gamma/log graph confirms this, though it might be confusing for some: The yellow line is our 1886 target; the grey line is what the display is actually outputting. This graph is not charting luminance output, rather it plots the relative power function (so if the grey line runs above the target, it’s too dark).
The key thing I’d like you to focus on is that gamma/log curve: CalMAN takes your most recent 0 and 100 signal level readings and the software calculates what the target values are for everything in between in order to hit the BT.1886 curve we specified at the onset. As such, none of the targets are tied to an absolute output level, but are always relative to your two extremes. The bottom end will ideally be pitch black (but of course never is), the peak white you recall should be 100 nits, but there is some situational latitude here. 120 nits is widely regarded as “acceptable” for environments where absolute ambient light control is moderately compromised (if severely compromised you have no hope of achieving an accurate image anyway). So if you want, or need, to set your peak white out of standard, the software is ok with that, recalculating all the target points for you.
Better displays will have a so called 11-point (or more) RGB adjustment facility where we can tweak the RGB balance and, by proxy, the luminance of the display at 11 points from 0 to 100. Using these we bring both greyscale and gamma into alignment.

CMS Adjust
If your display is half decent it will offer the ability to fine tune its color decoder. For each of the three primary colors (red, green, blue) and three secondaries (cyan, magenta, yellow) there are three parameters which express their position in the color gamut. Hue (aka DeltaH), Saturation (DeltaC), and Brightness or luminance (DeltaL). Using the corresponding controls in the display we adjust these to get the DeltaE error as low as possible for each color. In this example you can see that the TV is just about covering the desired color gamut, 98.9667% of it to be exact.
At this point one goes back to the start and does it all over again because these adjustments are very much interactive, affecting each other subtly. When that’s done you go backwards, forwards, and over again until you are satisfied you’ve got it as good as you can (or perhaps I should say as good as the display in question is capable of).

Post-calibration Result
Finally, a “post calibration” series of readings is taken which we can compare to the pre calibration series and pat ourselves on the back for a job well done. Except in this case our greyscale/gamma is still a little bit off with many points reaching a DeltaE of 2, though color looks pretty darn good. Our peak luminance is a little low for my taste at 82 nits so if this were an actual calibration I would raise the backlight level….and go through the whole workflow yet again.
Now let’s switch gears to HDR, starting with Dolby Vision.
Part 5: High Dynamic Range (HDR): HDR Calibration
Part 6: High Dynamic Range (HDR): Current issues
Part 1: High Dynamic Range (HDR): Fundamental Concepts of Dynamic Range
Part 2: High Dynamic Range (HDR): Dolby Vision and HDR10
Part 3: High Dynamic Range (HDR): An Explanation of Resolution and Color