Welcome to my continuing examination of the ARC-2 room correction system with some Dirac comparisons and usage suggestions thrown in. Dirac will have it own Guide to Tweaking coming up later. As a Super Geek, you are willing to try things that may make things worse, understand why it turned out that way, and move on until you get the better sound you are after.
Since you’re a Super Geek you should have no problem is this next section, which needs a good understanding of the electrical Equalization Curve.
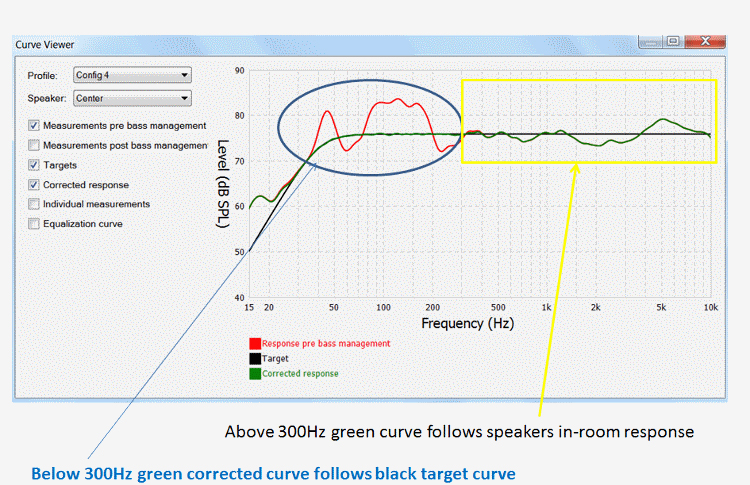
At the Max EQ frequency, the Corrected Response curve transitions from following the target curve to the uncorrected response.
We want the average in-room response of the speaker above Max EQ to follow the level of the speaker in the corrected area. In the case of ARC2, 75dB is the nominal target curve level.
The result I present above shows what post-correction response should look like. The speaker is flat on its own from 300Hz -1.5kHz and in that frequency range, it is sitting at about 75dB. From 1.5kHz to 4kHz, we see a depression in the speaker response. This is the midrange getting directional which reduces the early reflections which in turn reduces the in-room average response. When the tweeter kicks in, the level moves back up since it is not directional at the crossover.
This is the natural voicing of the speaker. We do not want to EQ that out which is why Max EQ is at 300Hz. Note if we were to flatten the depression what we would be doing is increasing the on axis response. A bump would be introduced if we did an anechoic measurement on axis.
If you do not like the natural voicing of the speaker, you purchased to wrong ones. Setting Max EQ to 5kHz may make you happier by trading flat in room for lumpy on axis but you are correcting a bad design. Super Geeks study the design of any speaker they may consider for purchase and look at every measurement ever published. A Super Geek would never purchase a bad speaker. Let us assume the bad speaker is at a friend’s house and you have been called in to make things better.
You can test which Max EQ setting, if you have to move past 300Hz, by placing different values in each profile. Keep all other Target Customization settings the same, and listen to the 4 profiles to select the best one.
It is always possible that you do have a good speaker but it is badly placed. Modifying the speakers toe in angle will change these energy depressions as well as the top end rolloff. Use Quick Measure to see what happens as you change the toe in. Moving the distance from the rear or sidewalls also can smooth things out.
Secrets Sponsor
Center, side, rear and especially ATMOS speaker will not be optimally placed. As a result, you are going to see issues in the frequency response above 300Hz. The only thing you can do to correct for these placement issues is bring Max EQ up to a frequency that flattens these. This will unfortunately reduce the quality of sound from, well designed, well placed, front channel speakers. The only solution is to make a 2-channel profile for music with Max EQ at 300Hz and a profile for multichannel with Max EQ at a frequency high enough to remove issues in the other speakers. Since ATMOS speakers can look worse than the rest and need a higher Max EQ, you may need a 3rd profile for ATMOS.
Note Anthem ARC has one Max EQ for all speakers.
The next curve is a repeat from the earlier Geeks Guide with some different annotations. I took screen scrapes of four different frequency response curves available in the Curve Viewer and aligned them to show how ARC2 flattens the post-corrected response below Max EQ = 300Hz
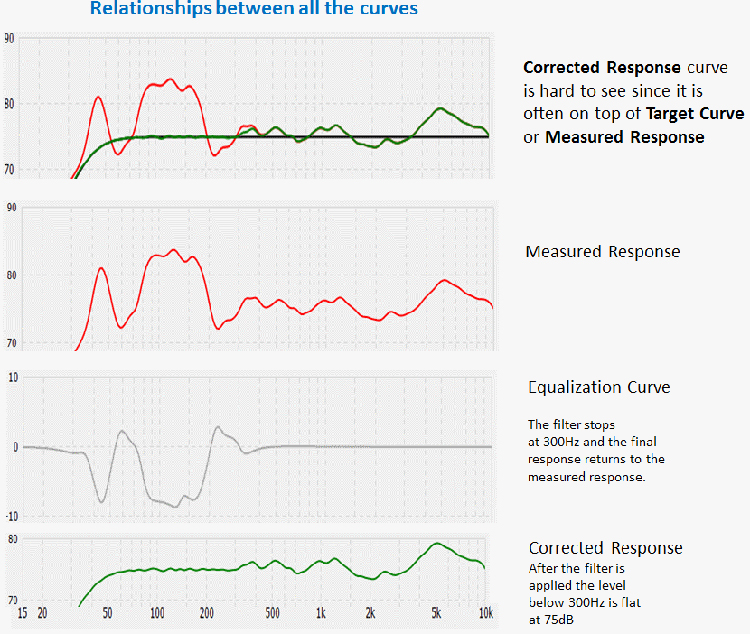
Above 300Hz, the Equalization Curve goes flat and the pre-corrected and post-corrected responses match.
Not all speakers will be optimally balanced with the 75dB default Reference Level like the one in the above figure. In that case, we need to move the Reference Level to match the average uncorrected response. The figure below shows where you enter the value in ARC1.

At the moment, ARC2 does not have a panel where you can enter the Reference Level. The Anthem folks are debating if they should restore it. We will see the issue below.
The good news is Anthem gave me a work around to set Reference Offset. The bad news is it requires editing the .ARC2 file. The .ARC2 file can be read and corrected with a simple text editor (do not open in Word). I am reluctant to show the edits in the .ARC2 file that change the Reference Level for each profile. Anthem did not intend you to be changing .ARC2 files. If you email me, I will send the instruction but to be used at your own risk.
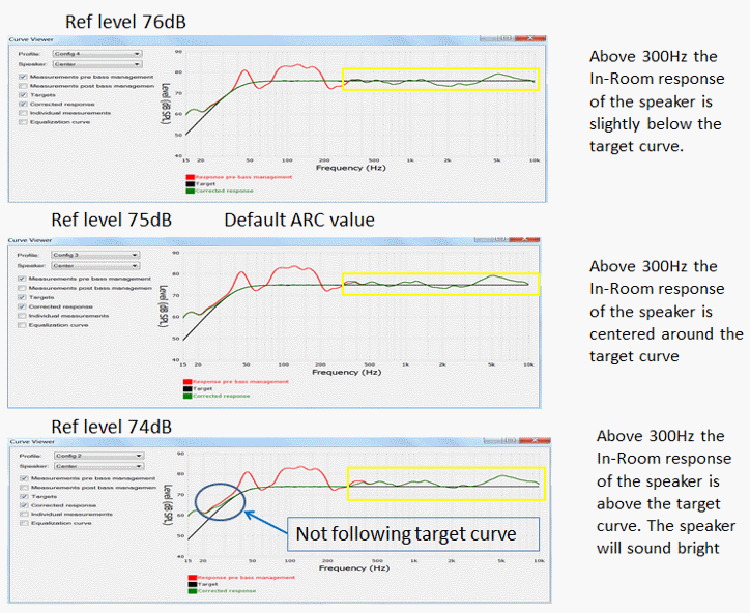
In ARC2, the preset Reference Level is 75dB. In the figure above, I have changed the Reference Level above and below the preset value in. At +1dB the target curve is moved up to 76dB and -1dB moved it down to 74dB.
Note that at 74dB, the rolloff no longer meets the "real" target. The two should have overlapped, as they do with 75dB and 76dB. This is a full range speaker so this is not an issue. If a subwoofer were in the system, the transition would become misaligned. That gap worries the ARC2 engineers, which is why reference level may not come back. The Reference Level is global so it moves the subwoofer level and an error is only going to occur during the transition. In many cases, I find the trade acceptable, which is why I am going to spend more time with the reference level.
To understand why this is happening, let us look at how the Reference Level is changing the shape of the corrected response below EQ max.
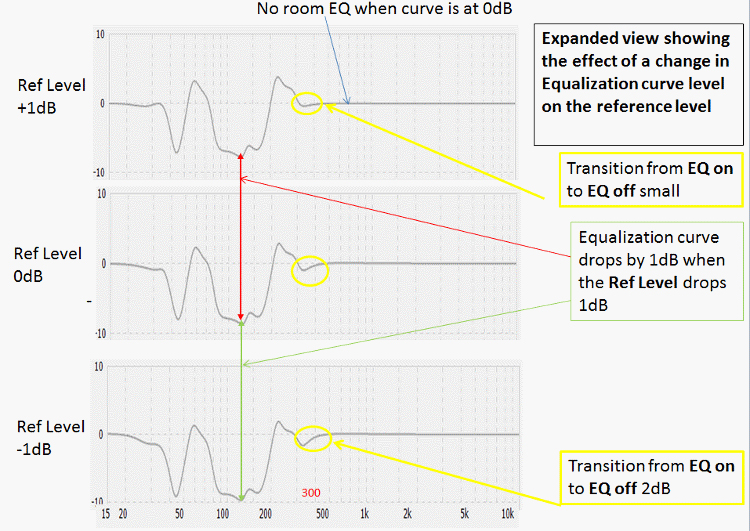
Max EQ frequency off does just what the name says it does. No correction is applied and the gain is 0dB above the transition point (for EQ Max of 300Hz the final transition is around 500Hz as will be explained below). The level above Max EQ never changes since the pre-correction and post-correction responses are the same level i.e. like a piece of wire.
What moves as we change the Reference Level is the correction curve below Max EQ. When the Reference Level is increased, the electrical correction curve is increased by that level. Note the speaker is slightly lower in the corrected area just below Max EQ (300Hz in this example) then the flat curve above Max EQ. A transition band (300- 500Hz in this example) is needed to splice the levels. Getting the transition band correct is critical and ARC does it correctly.
Secrets Sponsor
Note that as the Reference Level goes down, the difference between the edge of the correction band below EQ max and the flat line above EQ max grows and so does the curve in the 300Hz – 500Hz transition band. That includes the target curve low frequency rolloff, hence the gap noted in the figure above.
I hear you are asking why are you showing me all this. The speaker did not need a Reference Level trim. Unfortunately, that is not always the case as we see in the next figure with a different speaker in different room.
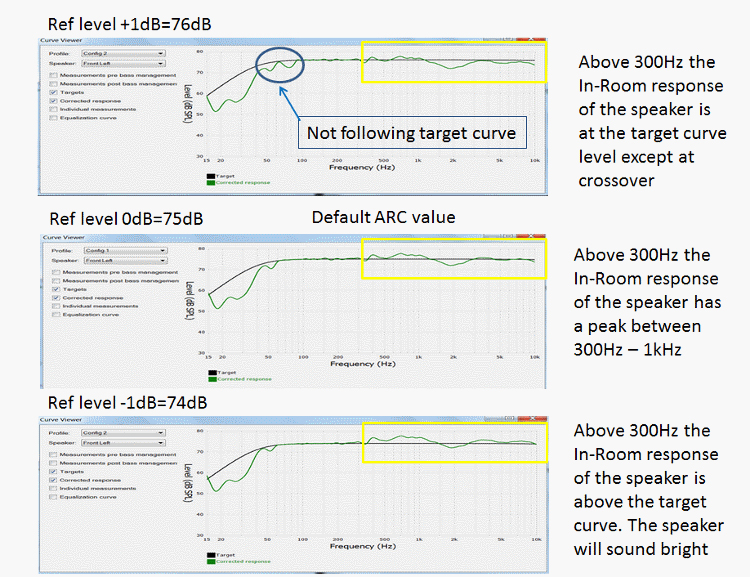
As you see for this speaker, adding a 1dB to the Reference Level (76dB) removes a peak 300Hz-1000Hz at the cost of increasing the energy loss around the crossover the tweeter. Unfortunately, you can see this also created a target curve gap at the low end.
These adjustments need to be confirmed by subjective evaluation. If you were to look at the ARC2 file, you would see each profile has its own reference level so you can use four different values. Profile 1 can be 73dB and going up in 1dB steps Profile 4 would be 76dB. You can listen to the change by selecting each profile and pick the one you like best. By doing this you have no need to download and listen to each profile. You just switch profiles with the AVR GUI.
In ARC, one reference level applies to all speakers. What works for the front channels may make the others worse. This is another issue that is concern to the ARC engineers. You have to look at each speaker to see what happened with the change. If each speaker had its own reference level, the SPL value with pink noise would have an offset. The speakers would be out of balance. Only the stereo pair may look better in your system with a reference level change, in this case it becomes a stereo only improvement.
It is inevitable some Dirac people are reading this and some of you Super Geeks may have both in different systems. Dirac will be getting its own tweaking guide as I start my evaluation of Dirac. I am introducing this now since we spent the “ink’ describing what it does above. As I mentioned a while back, Reference Level lifts the level of the correction curve. In Dirac, you do that by changing how you draw the red target curve. An example is below.
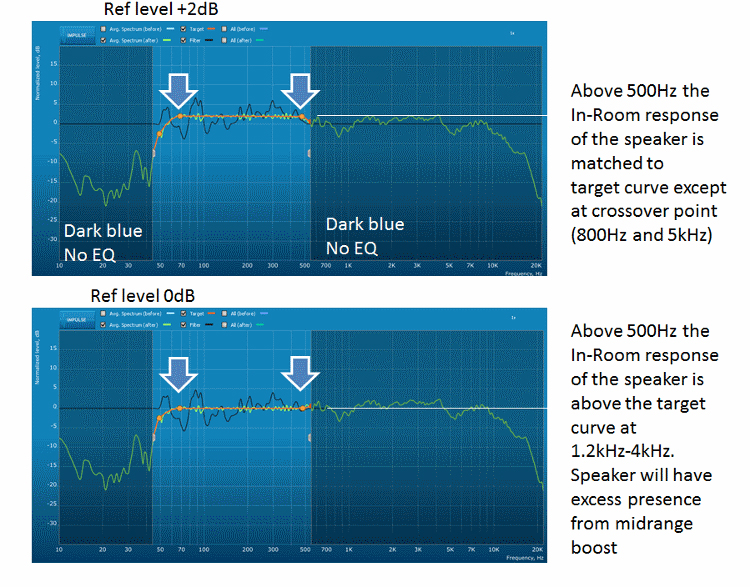
With Dirac, you put dots on the target curve to shape the curve. In Dirac speak these dots are Anchor Points. Everything I outlined above for Anthem ARC involves entering a parameter in the target parameter box to shape the target curve.
In Dirac, Anchor Points are mechanism used to achieve the same goals by shaping the target curve. Dirac has Max EQ and Min EQ for all speakers. Dark Blue is set to EQ off and light blue EQ on. Green is the corrected response. In an upcoming Dirac tweaking guide I will provide more information on what to do with anchor points. In this article I am just showing how to change Reference Level in Dirac.
From the two Dirac graphs above you can see how you change the Reference Level curve by moving the anchor points up or down on the red target curve. In Dirac, all frequency response graphs are normalized to 0dB not the actual SPL value.
For the speaker above, we see a dip at the woofer-midrange cross and at the midrange-tweeter crossover as a result in dispersion changes at the transition. We want to leave those alone and move the target curve to the level when the midrange is fully active (1.5kHz -4.5kHz). This required moving the target curve up 2dB (first graph). The second graph shows the target curve centered at 0dB. Now we have a midrange peak. I have arrows at the Anchor Point changes and a level line from the target curve to the midrange. Note this speaker required Max EQ at 500Hz to remove some peaks in the 300Hz – 400Hz range.
In Dirac you can have a different reference level for each speaker but as mentioned above if you use different reference levels you change the overall balance of each speaker relative to each other.
In the above Dirac plots, the Black is the electronic equalization but this has been removed by Dirac about a year after the original release (2014). These graphs in this tweaking guide were created with Dirac version 1.0 of the computer music version of Dirac. When I saw they took the curve out, I reverted to the early version.
You have seen how useful this electrical equalization curve is in the Anthem Curve Viewer so removing this curve in Dirac makes no sense. In Dirac it is even more important because an improperly drawn target curve can cause clipping. The missing electronic equalization curve in Dirac is a far more significant issue than the missing reference level set in ARC.
Unlike Dirac and the new Audyssey products supporting the PC app, it is not possible to adjust the target curve to introduce a slope at the top end or vary the curve in other arbitrary ways to change voicing such as following a dip near the crossover with ARC.
You have a trade here in that Max EQ must be high enough to cover any changes in the target curve. A better approach is to stay with Max EQ at 300Hz (as I did with the Dirac example above) and introduce equalization function past the room correction block. This is the approach used for Dirac on the Datasat, miniDSP DDRC 88BM and DDRC 24 products. No Anthem product has post room correction equalization.
The ability to arbitrarily shape a target curve does have disadvantages. We discussed above how much easier it is to change room gain using ARC by filling in the single value directly and allowing the system to build a curve based on the uncorrected room gain of your specific room. You change just 4 numbers, one for each profile, and listen. With Dirac, you have to draw the 4 room gain curves you want and pull Anchor Points around to match the drawings before you can do any listening.
On the other hand, some parameters in ARC2 are global. Max EQ is one and Calibration Offset (if you could change it) is another. Dirac gives you freedom to change those for each speaker.
The most significant issue with Anthem ARC is the limited number of parametric EQ filter sections (frequency, Q and level) available to build the ideal correction curve for some speaker and room combinations. One example was demonstrated above in the section on setting the HPF filter value for full range speakers.
Different Anthem products have different numbers of filter banks although they have never specified the number for a given product which would be extremely helpful. More filter sections require more real time DSP computations per channel.
It is important to note that the corrected response and the associate equalization curve as displayed on the ARC2 PC program show the correct post correction result for each product. Anthem products with less parametric EQ filters sections show worse post correction results.
It is not clear, at this time, if the Dirac PC program changes the post-corrected curve changes with a size change of the filter bank with the specific AVR or Pre/Pro being used.
I have tested the Dirac Live Room Correction Suite sold direct by Dirac for PC music application, and 3 miniDSP standalone room correction products (review of the current DDRC 88BM is coming soon). These products did produce, for me, an independently measured in room curve that matched the Dirac PC screen pre and post-correction. The PC music version uses the vast power of the Intel processor to do the real time filtering. The miniDSP products have a DSP that only does room correction functions in an external box.
Datasat and Theta products have at least one dedicated DSP of Dirac.
ARCAM and Audio Control use a single package quad core DSP (Cirrus CS49844) which implies reduced computational power for Dirac since the four DSP in the one package are not as powerful. It is possible the Dirac code could have been rewritten for greater efficiency. This is the same DSP used in the MRX20 products as well as many products from Denon, Integra, Onkyo, Marantz and Pioneer.
Anthem D2 products have DSPs that produce more parametric EQ filter sections and this can be seen in the post- corrected curves on the ARC PC display. The new Anthem STR stereo product produces even more parametric EQ sections filter section. Being only 2.2 channels instead of 11.2 the STR DSP has much less to do and the filter banks for the four channels can be made larger. Again, connecting a STR changes the post-correction curves on the PC display. Older MRX00X had less parametric EQ sections per channel and ARC also shows this in the post-correction curves on the PC display.
The Denon / Marantz products jump to 4 individual Analog Devices DSP chips to do Audyssey Multeq XT32 in ATMOS products. The Cirrus CS49844 can only do Audyssey Multeq XT (not 32) for 7.1 channels.
Looking at screen shots of products using Dirac on the single chip Cirrus quad core DSP that reviewers sent to me, I do not see signs of reduced performance which is a surprise. Unfortunately, our reviews have not included independent acoustic measurement of the performance of the Dirac products they were testing to verify correspondence of the post-corrected curves on the Dirac PC display to the actual results. I hope we will be able to perform these measurements soon.
With this article, additional methods to improve the sound of your system with Anthem ARC-2 have been introduced. I also showed how you would make these changes using the Dirac target curve.
More articles on room correction are coming from me, but as a Super Geek you want more now so be sure to read a new series by Bruce E. Krell, Ph.D called Audio Frequency and Loudness.
Also in the Secrets technical section is another article you should look at:
Multiple Subwoofers: Benefits & Setup
by Sumit Chawla, Ph.D.
As I said at the conclusion of my earlier articles on room correction – the more time you spend optimizing speaker placement, examining the frequency response graphs, changing parameters and listening to the changes, the better your system will sound. No expense is involved in optimization only your time. Listen and change one parameter one week and another the next week. Again, it is time not money that will bring you a better sounding system. The more time you spend, the better things will get.
The author wishes to thank Robert Kozel for his contributions to this article.


