Anthem has added many functions since then. You have seen the basic ARC-2 panels in many of the reviews of MRX-X10, MRX-X20 and now the AVM 60 in Secrets. These product reviews tend to use the Auto Detect function which sets all the parameters automatically
The advanced panel is the key to getting the best sound from any ARC enabled product. ARC does not have draw it yourself target curves like Dirac and the Audyessy PC app. You instead control the shape of the target by entering values into the panel.
This article is split into two parts. This part contains introductory material and covers the changes you can make just using the ARC-2 PC software as Anthem intended it. The conclusion assumes you want the last ounce of what can be produced by ARC-2 even if that requires an out of the box approach. For that reason, I am calling it the “Super Geek Guide to Tweaking ARC-2”.
I will be mentioning Dirac more than a few times here. Anthem ARC and Dirac have advantages and disadvantages. Dirac will be getting its own tweaking guide so here I only discuss significant differences to ARC. You would really need both tweaking guides to get a full application of which is better for you. Anthem is like Apple in that they control the ARC ecosystem. They do the hardware and software and you cannot find ARC on any other brand. Dirac is integrated with 3rd party hardware and is only a room correction program and not a bass management system. Those 3rd parties can add a lot of flexibility by providing extra signal processing around Dirac. Datasat and the miniDSP 88BM are good examples. Unfortunately, less then fully integrated versions of Dirac hardware also exist. There is more on this subject in the upcoming article “Super Geek Guide to Tweaking ARC-2”.
This article looks at the latest improvements in the ARC-2 room correction system. ARC-2 is the software found on Anthem products that use the internet port to communicate with the PC. Older Anthem products that use RS232 to communicate use the older ARC1 V3 on the PC.
The user’s manual that comes with an Anthem product covers ARC in a couple of pages. That is not enough space to fully explain all the options and how to use them. This article is not an attempt to write a bigger user’s manual. Instead, I show how I use the advanced options if I was doing the optimization. Not all my suggestions would match what Anthem application engineers recommend especially when we get to the “Super Geek Guide to Tweaking ARC-2”.
Note I did not attempt to verify the frequency response plots with independent measurements. That was covered in my article of ARC-1 v3. I assume you have read part 1 before you approach this article. If you are using a subwoofer you also need to read part 2.
I did not actually test any Anthem products that supported ARC-2. Instead, I took files from Secrets reviewers when they were testing one of the Anthem products. I made changes to the advanced panels and sent the files back. I then waited for feedback from the reviewer. For this article I used measurement files sent by Anthem which best showed how one of the new functions could be used. Anthem sent me many files created with different speakers in different rooms. Nothing was special with Anthem data relative to the reviewer’s files. It just turned out the files Anthem sent had frequency response curves that were most useful to demonstrate how to use an advanced function.
The ability to modify the ARC files on a computer that is not associated with the hardware allows 3rd parties to tweak your files. I cannot do the same thing when a reviewer tests a Dirac based product since Dirac requires the PC software to be locked to one computer. For reviewers working with Dirac, I have been left to examine screen scrapes and then I draw suggested target curves by hand sending them back to the reviewer to replicate.
Anthem lets you send files to an application engineer who can examine your measurements and supply suggested changes in the same way I did with the reviewer files, but Anthem apps personnel have a different view how to do it then I do. I tend to be more aggressive in moving off auto detect. My approach assumes you have time to make a change and listen to see if you made things worse. If it is worse perhaps, move the parameter half a step or keep what you had. It is like getting new glasses. Better now or do you want to go back. I will explain, using the ARC frequency response displays, why I think my changes will improve your sound.
The panels in this article are from the ARC-2 v1.4.4 which added a number of new features over the original ARC-2 v1.0. ARC-2 keeps evolving. It now ships as version v1.7.5. The new version mostly fixes bugs. The one difference between the panels I show and what new version is the frequency response x-axis now extends to 20kHz although Anthem notes the “measured result above 5 kHz is often unreliable”.
Secrets Sponsor
The Anthem MRX-X20, AVM-60 and new STR stereo integrated amp have some functionality in ARC-2 that is not available in the MRX-X10 products. All products use the same version of ARC2 PC software which knows from the file if it is associated with an X10 or X20 product. I will point out which functions only work with the MRX-X20 products. For the rest of the article when I reference an MRX-X20 product I am including the AVM-60 and STR.
If you update the software, you need to check the “software info” txt file that is part of the download. Some updates require you to “re-calculate” the measurement file by clicking Targets, AutoDetect, OK, and Calculate”. For those who have used the advanced panels this introduces extra work:
“If you are using manually adjusted targets and would like to continue using them, re-enter them after auto-detection.”
Be sure to rename the file so you can make reference to all the old settings. You have lots to copy and if you are using all 4 profiles, the work multiplies since you need to repopulate each panel. At least Anthem has not released a revision that requires the measurements to be repeated. That was something that was required in one release of ARC-1.
The electrical equalization curve is the key to understanding how a room correction works. It is found in the new Curve Viewer panel not available on ARC1.
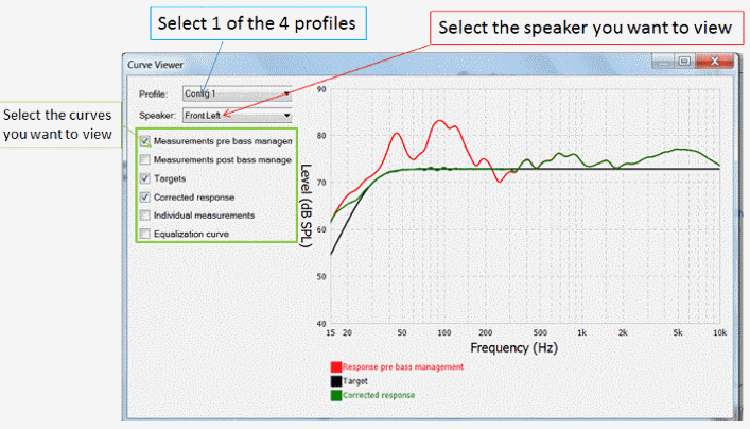
You bring up the Curve Viewer by selecting a tab in the Tools menu.
The Curve Viewer allows you to view 6 different frequency response curves for each speaker. The 6 curves available are highlighted in the green box above. The Curve Viewer can be dragged to fill the whole screen to improve resolution.
ARC-2 needs Windows 7 while ARC-1 worked fine with XP. I have my version of Windows 7 set to the Windows Classic Personalization. That makes it look like XP. ARC-2 frequency response graphs will not display correctly without using the Windows 7 Personalization. It is the first program I have used that required the personalization change. I switched to do the screen shots and then went back to classic windows.
Missing from ARC2 is the zoom function. This was available on ARC1. Zoom provides much higher resolution than can be achieved with the Curve Viewer full screen. It also introduces more grid marks as the span of the X axis is reduced. Dirac also has zoom on top of a full screen display.
In ARC2, all user-defined settings are grouped as a profile. ARC 1 and MRX X10 products have 2 profiles while the MRX X20 products have 4 profiles. At the top of the Curve Viewer panel, you select the speaker location and profile you want to view.
The last option in the green box on the figure above is the equalization curve. The panel below shows that selected.
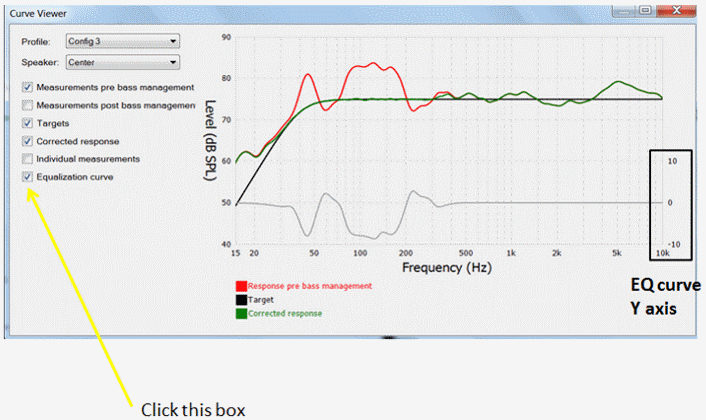
ARC1 did not show the equalization curve which we will be using many times below. You needed an external measurement tool to find out what the curve was in ARC 1. Dirac maddeningly had this and removed it saying it confused users.
In the Curve Viewer, the equalization curve can be viewed with the other curves but as can be seen above it now displays the Y-axis displayed at the right. All ARC 2 products produce the equalization curve but you need to have loaded version 1.3 or higher to see the right hand axis.
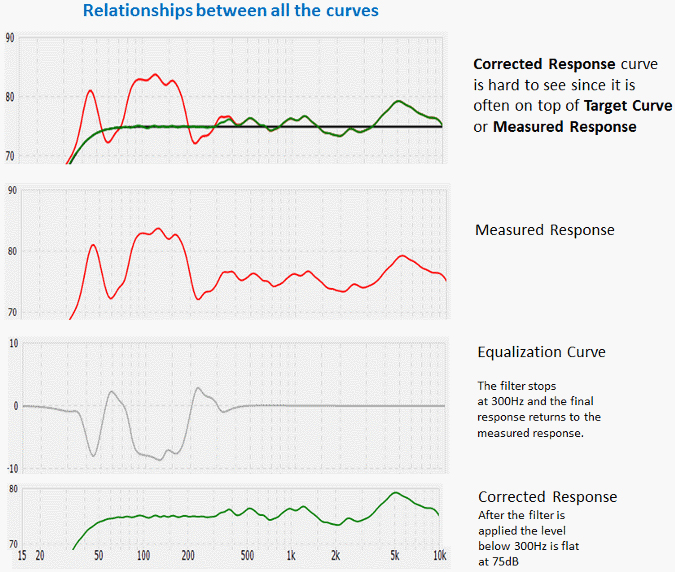
I took screen scrapes of four different frequency response curves available in the Curve Viewer and aligned them to create the next figure.
The first plot is the target and measurements pre-corrected, this is followed by the pre-corrected response alone, the equalization curve and the post-corrected response alone. The curve set shows how the electrical correction curve works to flatten the response.
For this curve set, the Max EQ frequency was set to 300Hz. No electrical correction is applied above that point.
ARC has 6dB limit positive equalization limit of which 3dB has been used in this example. Other room correction system will set different maximum values. It would be useful for this maximum to be adjustable in room correction systems but none offers that option as far as I know. One reason max boost is just 6dB in Anthem ARC is that excess boost can cause clipping when the input signal is at 0dBFS. As you can see, the attenuation can take on a much larger value. Dirac has a 10dB maximum which can cause clipping. The PC version of Dirac and some miniDSP products have a control to eliminate the clipping at a small cost of dynamic range.
Readers may recall seeing a similar curve set in my original ARC1 review. That set was done using my own measurement system.
The Curve Viewer has the ability to replicate another plot I could only create with my own measurement system in my ARC1 review. This is a display of each set of microphone measurements alone. The sum of these measurements is used to produce the average curve.
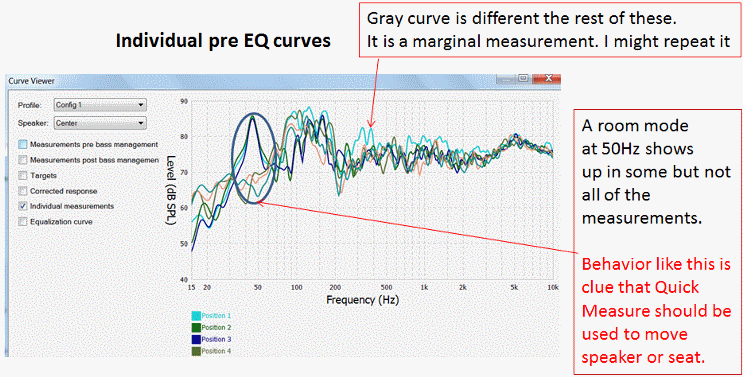
As shown above, you can identify where the individual curves are deviating significantly from the average. Moving the speaker may reduce these variations.
You can tell if one of the measurements you made may have been corrupted (gray curve in the plot above). Unfortunately, each added curve is not shown in real time. You have to wait for all the measurements to be completed before you can use the curve viewer. If you see a problem, you have to redo all the measurements. Anthem tells me the legend for the curve colors is intentionally limited to four rows below the graph (not a bug), otherwise the legend would take up too much area. The individual curves can still be identified using a different option in the view tab shown below.
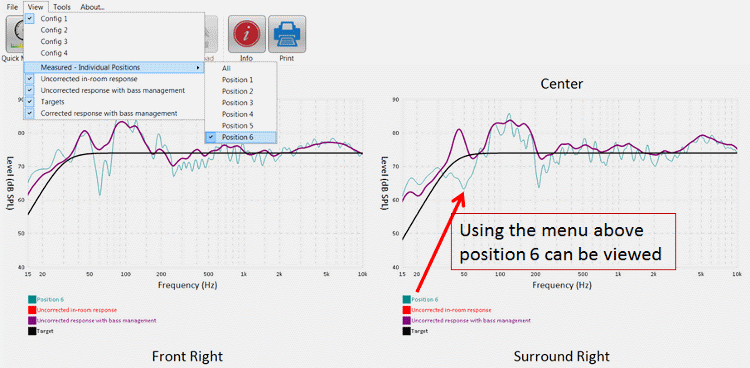
It would be ideal if you could see the measurement in real time, delete an aberrant one, and replace it. Dirac has the same issue. It displays all the individual curves after all measurements are completed.
I produced this set of curves myself in the ARC 1 review making measurements with an independent measurements system placing the microphone at the same position I used for the ARC measurements.
The system I used was Acoustsoft RplusD which does show the measurements in real time and allows delete. Once you have deletion on the fly, you really understand how it speeds up the measurement process.
Since you will be making changes to the ARC-2 file and it contains the measurements, you want to rename it before you start. That way you can get back to the original without redoing the measurements. It also helps to keep saving revisions as you make more changes. ARC-2 files are small and you can never have too many backups.
ARC2 has seen several important changes to the Target Customization panel. The Target Customization panel displays the Auto Detect values and provides places to change these to a user-defined value.
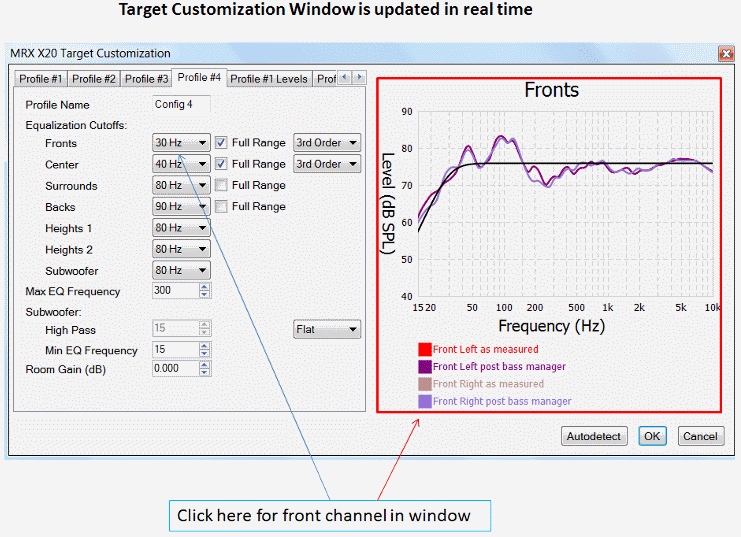
When a pull down menu is selected to change a parameter for a given speaker, the tool automatically shows the frequency response curve for that speaker. That is really important with an 11-channel ATMOS system. ARC 2 shows 7 curves, 5 stereo pairs, center and surround. As you make a change in a parameter, the frequency response display reflects the change.
Secrets Sponsor
As you change a parameter for a given speaker, the change will automatically be displayed in the frequency response plot on the Target Customization panel.
One thing that confuses people is the equalization cutoff of the subwoofer is often 120 Hz when Autodetect is selected. This only applies to the LFE channel. The other equalization cutoffs, above the subwoofer in the target panel, are the value that the subwoofer will start to become active. If one of those channels sends the subwoofer content, it will be just below that channel’s crossover frequency.
We now move on to a really useful display on the Target Customization panel that was added to ARC2. It looks a little different dependent on if your unit is X10 or X20. Below is the X20 display as a result of the increase in profiles from 2 to 4.
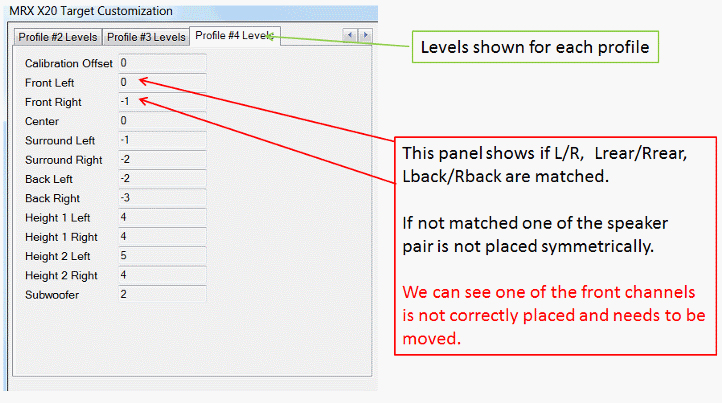
This panel shows the speakers level offset. With ARC1 and most other room correction system I know, you have to download the data and view these on the TV GUI. It is better to learn about level issues on the PC then downloading and looking on the TV GUI. It is still a pain to correct because you have to measurer all over again after you have repositioned the speaker.
This panel is only a report of the offset. They cannot be modified by the user.
With Dirac, the offsets are never displayed anywhere including the GUI speaker offset screen shown on the TV screen. The exception is the miniDSP DDRC88BM.
As you can see above, the level offset panel has signaled that the front speaker pairs are not ideally symmetrical. This indicates that one of the speaker pair wants to be moved a little although if your room is not symmetrical you may have to live with some offset.
Since ARC makes the level offset measurement based on the first microphone placement it would be useful if Anthem added a level only measure mode which just captures the levels on the PC screen with the mic in that one spot.
You can try to use the quick measurer function before you do all the measurements again. Quick Measure is also an ARC1 feature so head over to my original ARC review for more information about that function.
You need to make a screen scrape shot of the Quick Measure result before you move the speaker. Then move the speaker and compare results.
It is hard to see level matches below 1dB with Quick Measure, but it will show if the issue is a flat level difference or that the top end is dropping on one channel which points to a toe in issue.
What is nice about Quick Measure is it is in free run mode. You can move the speaker, see how the response is changed, and move some more until the response looks most even and with the greatest correspondence to the symmetrical channel. That screen shot of the before allows you to know where you started before the move and that things improved.
After all this work, I like to take length to wall measurements of each speaker as well as toe in. If the speakers get moved I know how to get them back to an optimum position.
I should note that once you start to optimize speaker placement doing multiple runs of ARC and using Quick Measure, it is advisable to have hearing protection on. If you Auto Detect, you press the calibrate button and move out of the area where the speakers are located. It happens just once. Now to improve the sound you and the calibration tones will be in the same room and you will be repeating the calibrations several times.
Hearing protection applies to any room correction system. Dirac tends to like high speaker levels for calibration and the level needs to be set exactly and interactively on the PC screen. Setting level this way makes the purchase of hearing protection mandatory with Dirac.
This section applies only if you do not have a subwoofer or have a subwoofer but want to set some profiles to use the main channel speakers only. Only the MRX-X20 family products have the panels I show in this section.
If you are using the subwoofer all the time, skip to the section on Subwoofer Panel Setup.
If you have an MRX-X20 product, in addition to the high pass rolloff, an adjustment available in all ARC PC tools, you now can adjust the slope of the rolloff in the Target Customization window.
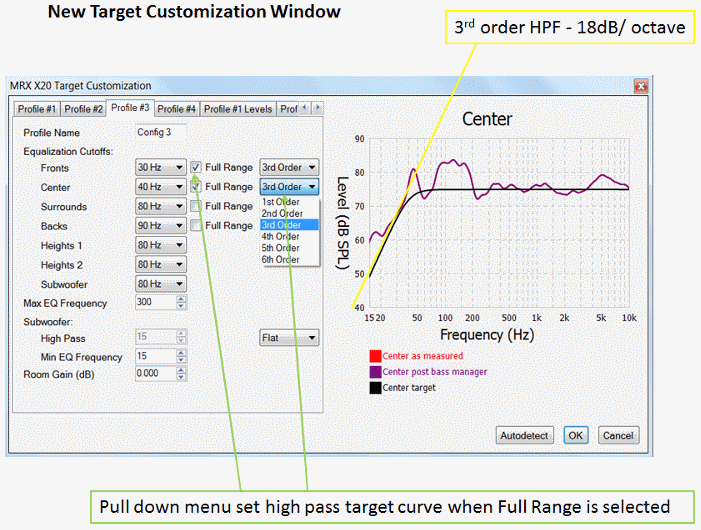
It is very important to prevent a room correction system from attempting to push the low-end rolloff of a ported speaker by increasing the Equalization Curve level above 0dB. At the same time, we do not want to rolloff the speaker too early and give up low frequency response. I show how to do this by varying the crossover frequency and slope of the center channel.
You can see that you can have up to a 6th order High Pass Filter (HPF). These are added HPF filter sections. You do not give up any filter sections used to build the equalization curve. If you use Dirac to create an HPF by bending the target curve too aggressively, you will be using the filter sections that could be used to improve the accuracy of the post-correction curve up to EQ Max. If the target curve is shaped to follow the natural rolloff of the speaker then you do not have to worry about this. More on this issue will be in the Dirac tweaking guide.
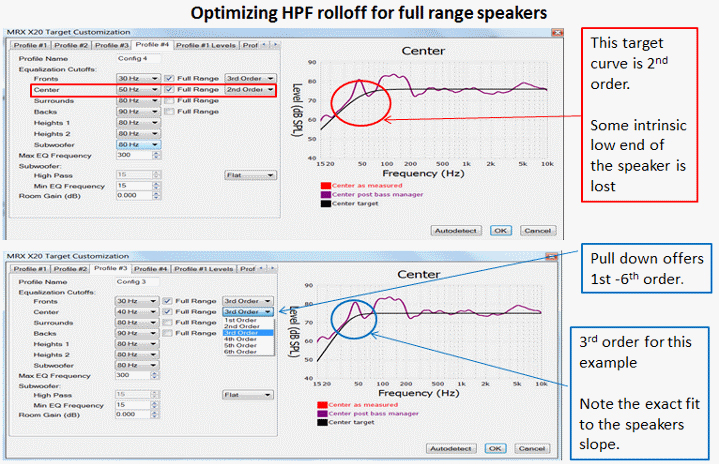
In the lower Target Customization window, the order of the target curve rolloff of the center speaker was increased from 2nd to 3rd and the cutoff reduced from 50Hz to 40Hz. All the intrinsic low-end response of the speaker is now preserved compared to the upper Target Customization window.
I am using the center channel because it shows only one curve not the stereo pair. As you can see, other settings apply to the other speaker pairs but only front and center allow slope adjustment.
In ARC1 your only option, besides the 2nd order rolloff, was flat setting. The next curve set of two Target Customization windows compares flat (no HPF) with the 3rd order HPF at 40Hz.
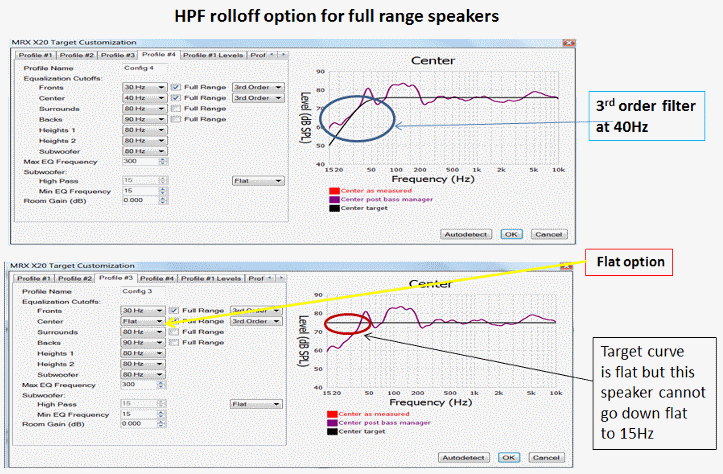
If you select flat the order tab setting is ignored.
It is now time to move from the Target Customization panel to the Curve Viewer panel so we can see the electrical equalization curve.
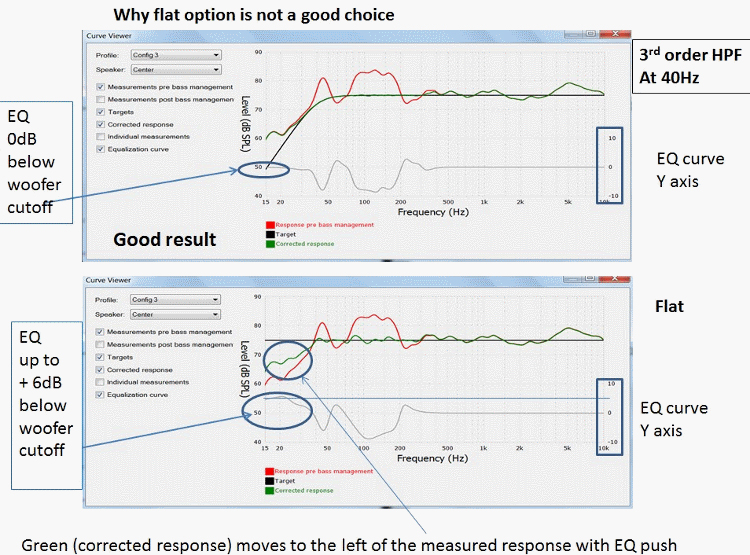
As you see above, Flat does push up the bass past 40Hz (lower panel). We can see how it did that by looking at the equalization curve. ARC has put in the maximum 6dB boost below 40Hz.
If you look at the upper panel with a 3rd order target curve at 40Hz, you will see no bass boost in the equalization response.
With ported speakers it is best not to push below the port frequency. With a sealed system, the speakers do not unload and start to flap around the way a ported system does. You can push a sealed speaker by lowering the target curve frequency. Watch the electrical correction curve to see how much boost is being applied. For a sealed passive speaker the target curve will likely be 2nd order.
After the adjustments have been completed, you should listen to your results. If you do not like something, change a target panel setting, and listen again. To prevent having to download the correction filters each time, make use of the multiple profile panels placing different settings for the HPF frequency and order in each while keeping all the other setting in the Target Customization panel settings the same. Download the results to the AVR and listen using the GUI to change the profiles.
ARC has a limited number of parametric EQ filter sections (frequency, Q and level) available for each channel. It depends on the model. Since the number is limited, you do not want to waste a couple sections doing a futile low-end lift. I show this in the figure below.
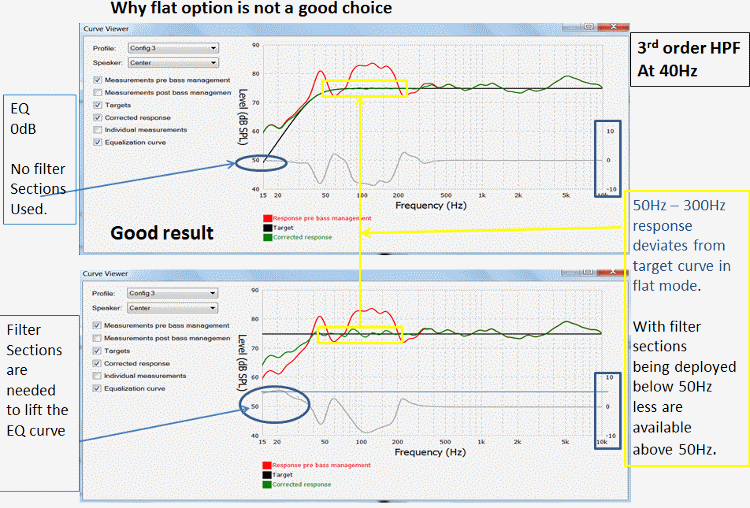
The figure is the same as the last one but now I have yellow boxes showing correction 50Hz -300Hz range. Note when flat was chosen filter sections were assigned to the lift below 40Hz. That left fewer sections available between 50Hz and 300Hz. The response in the yellow box is not as flat with the filters reassigned to do the lift.
You will also note the electrical equalization curve has more wiggles in the 40Hz – 300Hz band for the upper panel than in the lower panel. That is the extra filter sections more accurately shaping the correction curve when the 3rd order rolloff is selected.
Note a similar situation may occur as you move the Max EQ frequency to a higher value. Now some filter sections will be assigned to correct the higher frequencies at the cost of flatness below 300Hz. It is speaker dependent.
If all this sound way too complex, I have good news if you are not using a subwoofer. The Auto Detect function for the MRX-X20 products will make use of the crossover order of the fronts to best match to the intrinsic rolloff off the front stereo pair.
In ARC1 or ARC2 on an MRX-X10 product, Auto Detect only had a 2nd order HPF response to fit to the front channels uncorrected response characteristics.
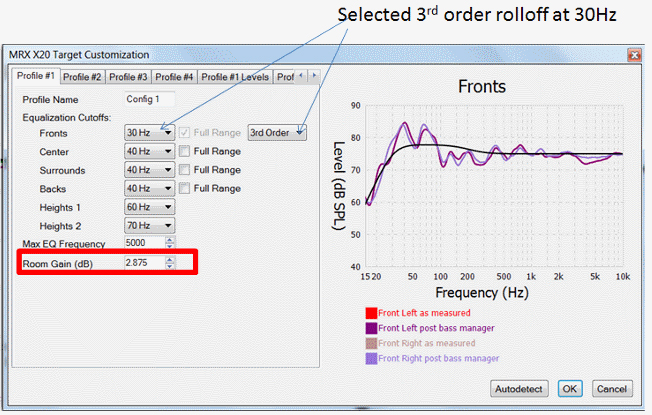
You can see the target curve rolloff closely matches the left and right channel speakers with the automatically selected 3rd order HPF, so Auto Detect has done its job well in this example.
All versions of ARC apply Room Gain to allow the speakers’ low-end response to approximate the uncorrected response below 200Hz. For this speaker the Auto Detect value was 2.8dB. Room gain is the easiest of the parameters to move off the Auto Detect setting. You listen, decide if you think the system is producing too much bass, and then back off the room gain value. Again, you put 4 different values in the 4 parameters leaving everything else alone so you can switch between them with GUI on the hardware and subjectively pick the one you like best.
The auto generated room gain target curve, found only in ARC, is far easier to use than trying to mimic it with a draw your own target curve function of other advanced room correction systems.
Since you have been reading this section on system adjustment without a subwoofer, you can skip the next section unless you are planning a split system with some profiles set for a subwoofer and some with it off.
Controls for high pass frequency and order target of the subwoofer are found in ARC 1, but they were hidden in the advanced panel. In ARC2, the subwoofer controls have been moved to the main Target Customization window.
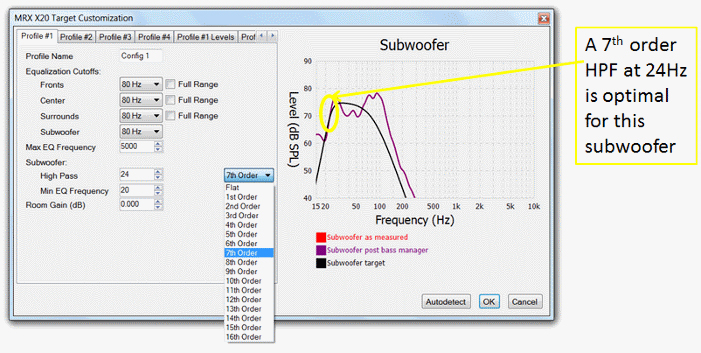
As you change the settings on the control panel in ARC2, the frequency response graph updates. Above I showed how the interactive frequency response plot on the right hand side makes it easy to see what occurs when you change a setting in ARC2. As you can see in the panel, I selected a 7th order high pass filter at 24Hz to fit the response of this subwoofer.
On the next figure I look at some other items to be found on the panel.
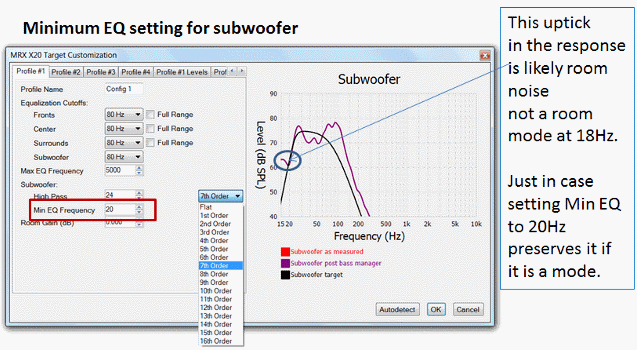
Minimum EQ places a lower limit on where EQ can be applied. Min EQ does on the left side of the frequency response plot what Max EQ does on the right side.
This prevents the room correction system from applying gain below subwoofer cutoff. This is only available for the subwoofer in ARC. This feature would be useful for any speaker set to full range. Some other EQs systems, such as Dirac, have the option for all speakers.
Note the subwoofer response goes flat around 20Hz and actually pokes up a little at 15Hz. This is very likely room noise that corrupted the results below 20Hz. Just in case it was real, I put Min EQ to 20Hz. That way ARC will not try to apply a correction to match the target curve, in this case continuing to roll off the speaker at a 7th order rate.
I now switch to the Curve Viewer panel to see what the electrical equalization panel looks like for the subwoofer we have just optimized.
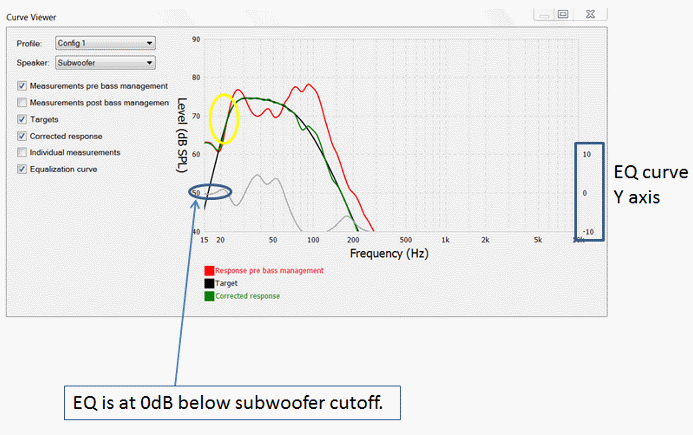
You can see this equalization curve supplies no gain in the range that the subwoofer is rolling off, which is exactly what we wanted. We do not want the room correction system to attempt to push the intrinsic rolloff of a subwoofer. Most subwoofers have active equalization to push the low end as far as it can go, often with the massive power amp inside the box. Most have a limiter to back off when the signal level is too high and the unit is about to damage itself.
Between 30Hz and 60Hz, the equalization curve lifts to flatten the corrected response (green curve). Above 70Hz, the equalization curve drops to shape the corrected curve to have a 4th order lowpass filter response. This will match the 4th order high pass filter response of the main speakers. Once a subwoofer is in the system, all main channel speakers have 4th order rolloffs with ARC. The main channel speaker rolloff can only be changed if no subwoofer is in the system as we showed in that section above.
It is important to have matched 4th order rolloffs for the LPF of the subwoofer to the HPF of the main channels. Most room EQs only have 2nd order rolloffs for the main channels. This creates problems which I will explore in another article.
The performance of Anthem ARC with its matched 4th order LPF and HPF was examined in my article on ARC1 performance with a subwoofer.
The level offset data on the PC screen is especially useful for subwoofers.
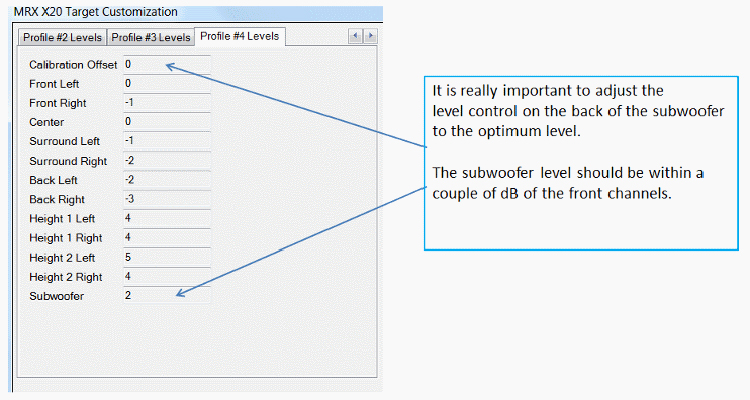
If subwoofer level is much higher than LF/LR, the signal to noise ratio of the LF/LR channel will be reduced (true for any room EQ). The AVR has to put in analog attenuation to match the subwoofer. In this example the levels are correctly set.
Quick measure can be employed to adjust the subwoofer level. I have a found that using a cheap sound level meter is also useful. Since a subwoofer is bandlimited, the level on the sound level meter when using the pink noise generated in the AVR level setting GUI will be lower than the true SPL. Instead, use the calibration chirps ARC generates. Select only left, right and subwoofer. Now watch the meter level as the chirp moves up in frequency for the left and right speaker. The subwoofer should have a similar average level in its range. Adjust the sub gain control until you have a close match.
With luck when you go back to do the multipoint microphone measurements, the level differences on the PC screen will be reduced. At least you do not have to wait to download the results and see them on the TV with the GUI.
As stated above, when you do these interactive level adjustments that require you to be near the speakers use hearing protection. That caution applies to any room correction system.
As I said at the start, setting the advanced parameter in the Target Customization panels is the key to great sound for your specific room and speakers. In reading the tweaking guide, you know what each parameter is and what it does. Couple this with using quick measure to find optimal speaker placement before applying room correction.
Use the four profiles if you have an X20 product (Dirac also has 4 profiles). All others have two profiles. Work with one parameter and fill in two or four different values in the profiles, increasing the value in each profile while keeping all other parameters the same. Download the data to the hardware and use the GUI to change the parameters on the fly while you listen. By doing this, you have no need to download and listen to each parameter change individually.
Listen to each profile to find the one most subjectively pleasing. This approach works for any change to the Target customization setting. Change one parameter and vary it. Get the value you like most and go on the next. Unfortunately, it is iterative and you may have to circle back to the first parameter and go a second round.
You can do this blind if you have a friend. Let them make the change but not tell you what profile was selected. They can even say they changed a profile when they kept it the same. This will help you identify changes you like best without the bias of knowing what the curves looked like.
You just need time to do the adjustments. The more time you spend optimizing speaker placement, examining the frequency response graphs, changing parameters and listening to the changes the better your system will sound. No expense is involved in optimization only your time. Listen and change one parameter one week and another the next week. Again, it is time not money that will bring you a better sounding system. The more time you spend the better things will get.
If 5100 words and 17 figures has not been enough for you on room correction with an emphasis on Anthem ARC-2, you are a room correction Super Geek and I have an added section just for you. Continue reading with the Super Geek Guide to Tweaking ARC-2 (coming soon).
The author wishes to thank Robert Kozel for his contributions to this article.


