

Unfortunately, the RTR deck I purchased was defective, and I luckily got a refund. Then, I purchased an Akai GX-625 reel-to-reel tape deck. It also turned out to be defective. The right channel was fine, but the left channel was very weak. I tried to have it repaired, but it sat at the first repair shop for five months. The technician said he was having trouble finding parts. He said he tried two different sources with no luck, so I had him return the deck to me.
Once I got the Akai GX-625 tape back deck from the repair station that kept it for five months without repairing it, I found and sent the deck to another repair station on the East Coast. He repaired it in one week, saying that the parts were generic and easily obtainable. He replaced three transistors, fixed the electronic speed control, lubricated appropriate parts, cleaned everything, and fully calibrated it for ATR tape. It is now in superb condition. So, it appears that checking out the potential repair station where you might be sending your vintage reel-to-reel tape deck is absolutely critically important.
He returned the deck to me. It cost $225 for the repairs. Shipping to and from the East Coast where the repairs were done was about $135 each way (I live in California). The parts were generic, so there is no reason why the first repair guy I sent the deck to in the middle of the country (USA) should have had the deck for five months without repairing it. He said the parts were on back order. I don’t think so.
I went around in circles getting the insurance that I bought at the same time to agree to pay the repair claim. When I purchased the deck, the company selling the deck said it was serviced. The deck originally arrived with brown tape residue all over the guides and heads (photo below).

The left channel did not work. I don’t believe this deck was serviced at all. If you plan to purchase a used deck, which just about all tape decks are, you have to be really careful, and expect that it will need repairs. Repair parts on the Akai were easily available. This is not the case for all brands of tape decks. Check for availability of parts before purchasing the deck. Ask about the brand and model number on reel-to-reel tape deck forums as to the quality of the deck and any known design problems. If you purchase a deck, and it needs repairs, go to reel-to-reel forums and ask for opinions on the best repair shops for your brand and model. Ask about any negative experiences with the repair shop you are considering.
I had our resident Ph.D. electrical engineer, Dr. David Rich, advising me. If I had not had his advice, I would have been screwed because I might have ended up with a deck that has reliability issues. The Akai GX-625 is supposed to be one of the best consumer reel-to-reel decks that Akai manufactured. It is not a fancy deck with a lot of features. Perhaps that is why it is so good. Not many things to go wrong.
I found information stating that certain brands and models had reliability issues such as motors, capacitors leaking or exploding, etc. I had originally considered a deck with 15 IPS speed capability. I was told that such decks were used by radio stations and got heavy use, and thus, the heads are usually very worn (they look flattened) and may require what is called re-lapping, which means polishing them so that the surfaces are not flattened. Expensive to have done.
Here is a photo of the repaired GX-625 deck.

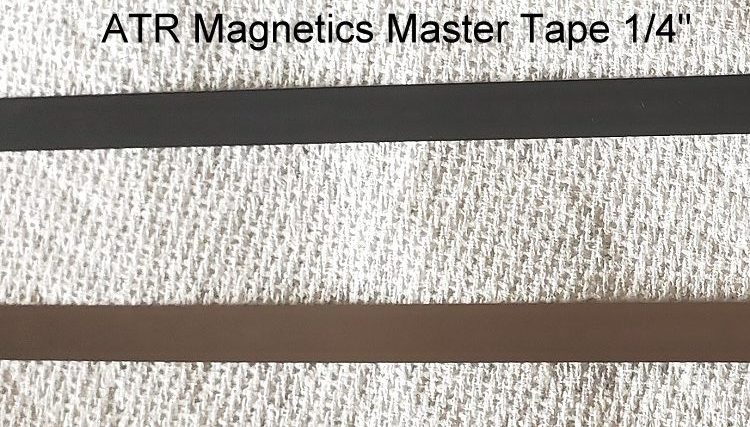
March 12, 2021 – For ATR Magnetics Master Tape, shown below, make sure the brown side of the tape faces the tape heads. The black side is the backing. I have seen comments on forums where one person says the shiny side faces the heads and another person says the dull side faces the heads. Both sides are shiny, so there can be confusion. The brown side faces the heads.
![]()
Here is a photo of both sides of ATR Magnetics Master Tape. The brown side is shown on the bottom, and the black side is shown on the top. The brown side faces the tape heads.
LPR35 tape from Mulann Industries also should have the brown side facing the tape heads. I am currently also testing RTM SM-900 which is a studio mastering tape.
On tape for RTR tape decks and other recorders like cassette decks, there are very small iron particles, stabilizer, lubricant, and binder. As the tape passes the recording head, the iron particles are magnetized with their North/South orientation determined by the direction of the current flow in the head. Varying signal levels (loudness) are represented by the strength of the magnetization. The various substances mentioned above are applied to the base material, which has been different types of plastic over the years (paper was used early on). The base is coated with primer, and then the other substances applied. On the rear of the tape is a back-coating, often being carbon black (carbon powder). The back-coat improves the tape’s mechanical performance during playing and winding, but also storage.
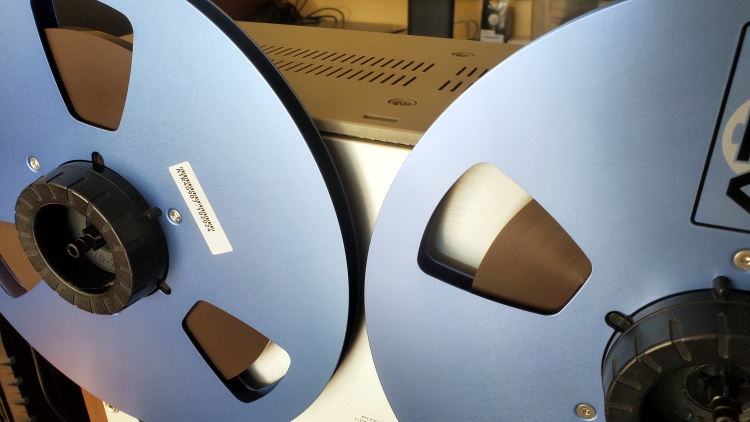
March 16, 2021 – When using the deck, including winding and re-winding, make sure the tape is wound smoothly with no visible ridges of the edges of the tape (photo below). If there are visible ridges, this can cause tape damage over time. The ridges appear as an irregular surface rather than smooth.
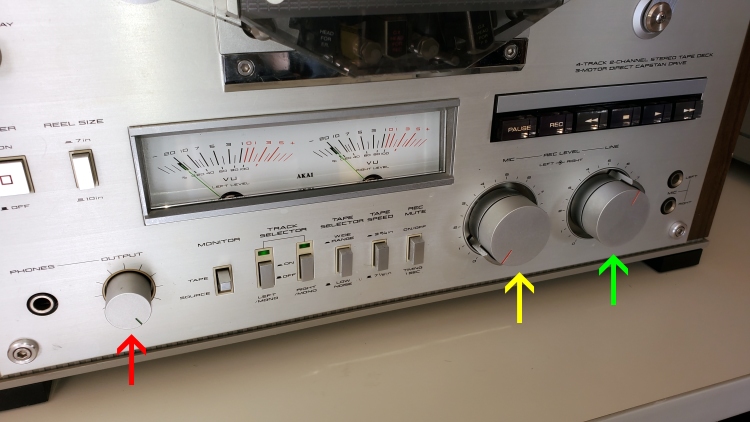
Here are some bench tests. I used the line-in and line-out RCA jacks on the rear panel. The phones output level control (red arrow) was turned up all the way. This is because that control affects the line-out as well as the headphones jack output. The left/right microphone input level (yellow arrow) was turned down all the way to reduce noise. The left/right line-input level (green arrow) was set to the desired dB VU when the test signal was recorded.
First a 1 kHz sine wave. The recording level was set at 0 dB on the VU meters (using the line input level control dial).
THD+N and THD were both less than 0.05%.
Next, 0 dB VU for the sine wave recorded and played from the tape. THD+N is high because of tape noise. THD, however, is still less than 0.2%. Notice that the noise floor of the tape spectrum is high compared to the noise floor of the source spectrum. That represents some of the tape “hiss”.
March 26, 2021 – I have had a number of phone calls about the name of the company where I had my tape deck repaired. It is as follows:
Precision Audio Services (AKA Precision Audio Restorations)
6589 Main Street
Williamsville, NY 14221
Phone: 716-634-8845
Web: https://precisionaudiorestorations.com/
April 2, 2021 – Frequency Response (FR) of the source vs. off-the-tape is shown below. Tape deck specifications for FR are usually at minus 10 dB VU, so let’s start with that. First, the source. I used an Impulse Response (IR) to derive the Frequency Response. This is produced by sending a short frequency sweep from the low end to high (20 Hz to 48 kHz).
As you can see, the FR is within about 2 dB. THD can also be derived from the IR along the complete frequency range, which is why the IR is such a powerful test procedure. THD for the source at -10 dB VU is between 0.05% and 0.15% from 20 Hz to 500 Hz and then about 0.04% up to 25 kHz.
Now, here is the FR and distortion for the -10 dB VU sweep off-the-tape. As a reminder, this is at 7-1/2 IPS (Inches per Second).
The FR is within about 7 dB between 20 Hz and 25 kHz. Distortion is high between 20 Hz and 35 Hz, and then it drops to between 0.1% and 1% for the rest of the FR. Notice that the highest signal output is in the midrange, between 100 Hz and 1 kHz. This may be what gives tape one of its desirable sound characteristic. Our hearing is most sensitive in this range. Also, the 2nd harmonic is the highest of the three harmonics measured here, i.e., 2nd, 3rd, and 4th. A high 2nd order harmonic is also a desirable characteristic.
So, what does the FR look like at 0 dB VU?
Here is the source. The FR is the same as it was at -10 dB VU. Distortion is lower, however, staying in the 0.1% to 0.008% range.
For the 0 dB VU off-the-tape sweep (below), the FR is now within 12 dB, 20 Hz to 20 kHz, instead of the within 5 dB at -10 dB VU. The midrange region is, again, prominent. Distortion is also quite a bit higher than at -10 dB VU. I imagine this is why tape deck specifications are usually stated at -10 dB VU. The 2nd harmonic is the principle one even at 0 dB VU, which is good.
For the Tape spectra, notice a small bump at about 50 Hz. This is typical of tape. Impulse Response-derived FR for tape decks have not been published before, as far as I can find. Nor have 2nd, 3rd, and 4th harmonic data for the complete frequency response range.
April 13, 2021 – Shown below is a frequency response measurement made by using white noise instead of an impulse response. The recording level was at 0 dB VU. The yellow line is the source frequency response. It is underneath the sound card frequency response (green and blue lines), so it is a little difficult to see. However, below 20 Hz and above 30 kHz, you can see that the source response drops off below the sound card response. Also, because I used a high resolution FFT, the sound card response declines 5 dB from the high frequencies to the low, so you have to take this into account when evaluating the source and tape frequency response. The tape response is shown in the red line. The response is boosted in the midrange, but drops off starting at 500 Hz, with a rapid decline above 10 kHz. The decline is larger than the tape response using an impulse response. What this tells us is that when there are a lot of simultaneous frequencies, the high frequencies are recorded at a lower level than when the frequencies are presented one at a time for longer periods. The white noise signal is more like what we would have when music is being played rather than with an impulse response or with singular frequency test signals. The boosted midrange is probably why we like the sound of analog tape so much, along with a high frequency rolloff which reduces the sharp “edges” of the sound.
June 1, 2021 – I purchased an Otari MX-5050B-III-2 tape deck a few weeks ago. It was listed as being in near-mint condition, and I paid several thousand dollars for it. The seller (a website that specializes in tape decks) said it had been thoroughly cleaned, lubricated, and calibrated.
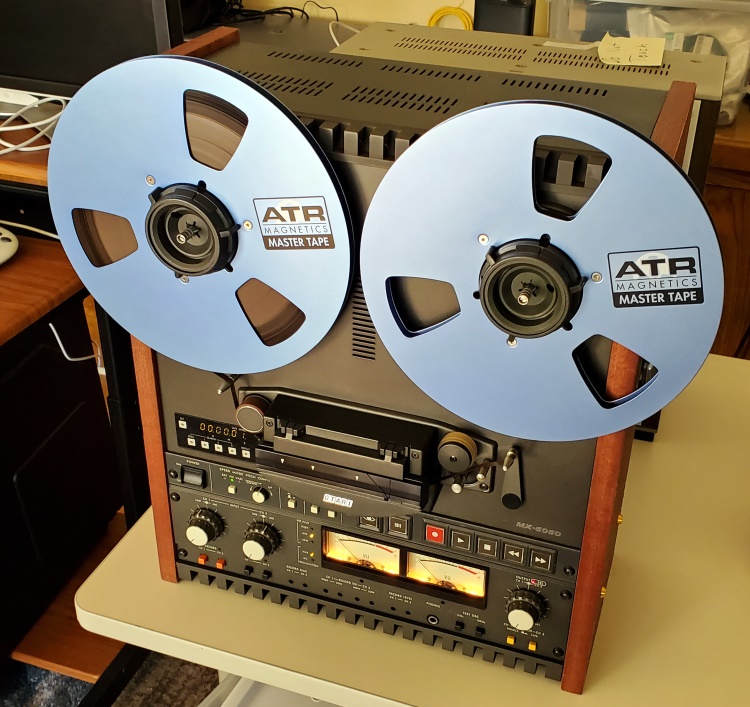
When I bench tested it, I found that I would need to recalibrate the bias for my ATR Magnetics Master Tape. So, using the 15 IPS tape speed, I measured the frequency response of each channel, and then I increased the bias a bit by using a small flat blade screwdriver to adjust the bias pots on the front lower panel beneath the VU meters.

There are two pots for this: RECORD BIAS CH 1 and RECORD BIAS CH 2. CH 1 is the left channel, and CH 2 is the right channel. I then remeasured the frequency response and made further adjustments until the response was flat out to about 10 kHz. At that point, I used the same screwdriver to increase the HIGH RECORD EQ pot (for the high frequencies) until the frequency response was as flat as I could get it out to 20 kHz. There are LOW RECORD EQ pots (for low frequencies) as well, but I did not need to adjust them.
Here are the adjusted frequency response graphs for the Source and Tape for each channel. The adjusted frequency response only applies to the Tape (playback from tape), not the Source (monitored from the input).


Although the high end FR is good, being down only a couple of dB at 25 kHz, the low end falls off below 50 Hz rather steeply. This is due to the 15 IPS speed. Low end FR is known to do this at the high tape speed. I would suppose that it is compensated for by using EQ during the editing process before cutting the master lacquer for making vinyl LPs.
In any case, this Otari MX-5050B-III-2 is a very good deck, and I am pleased that it turned out to be in such excellent condition. Its performance is dramatically different than my Akai GX-625 consumer deck. The Otari is considered to be a semi-pro deck, so the better frequency response is expected. The use of higher tape speed is part of the better response.
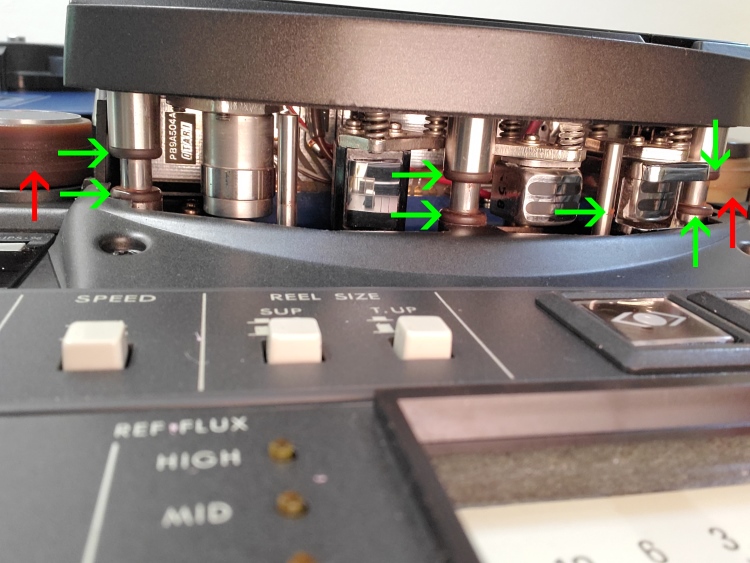
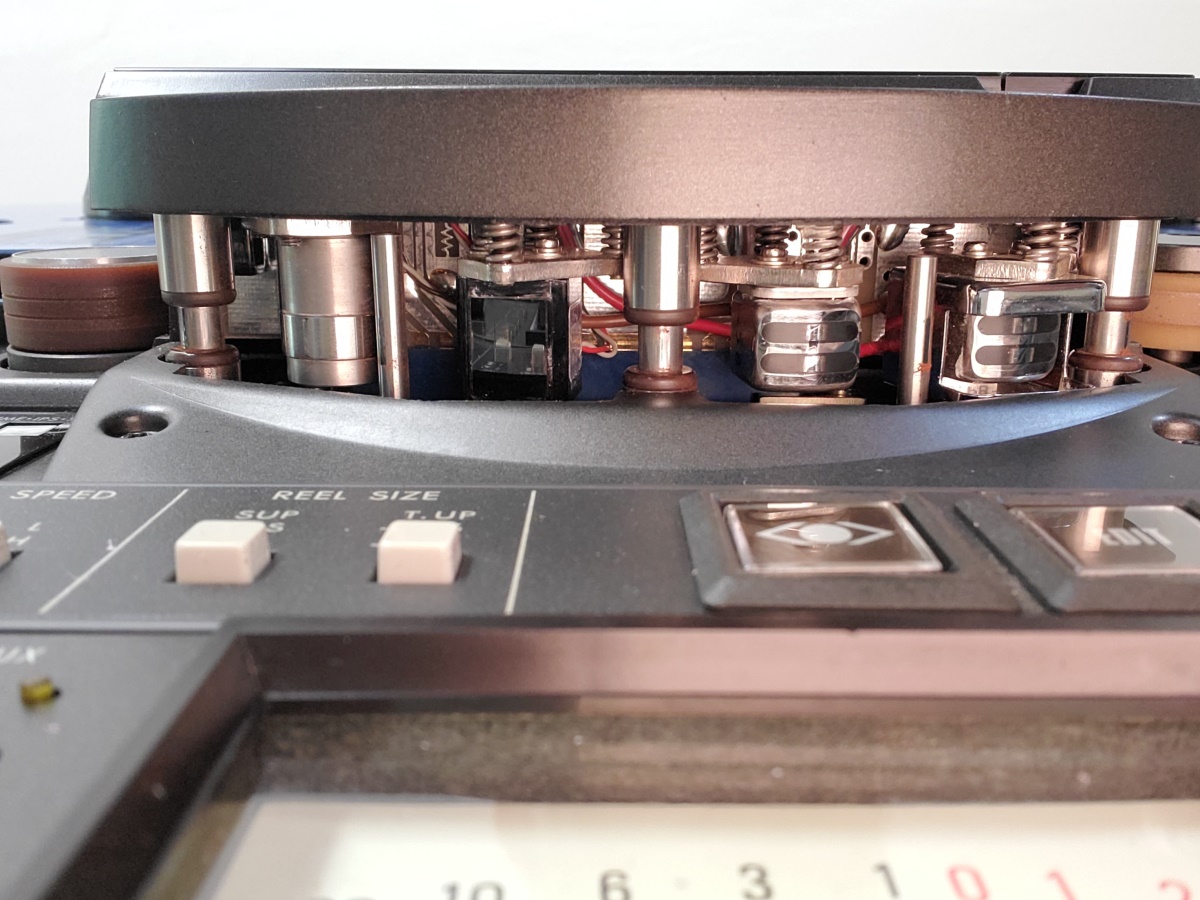
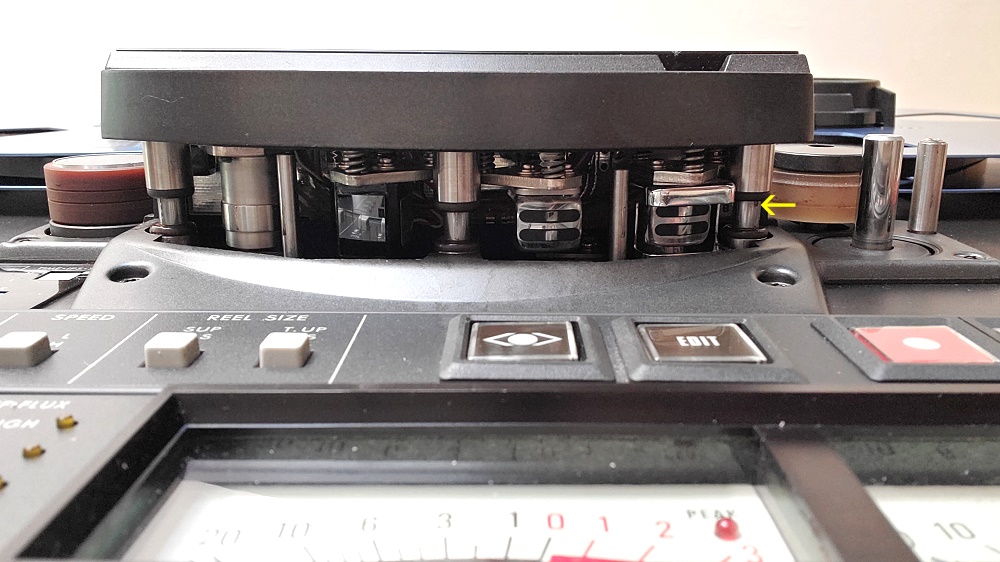
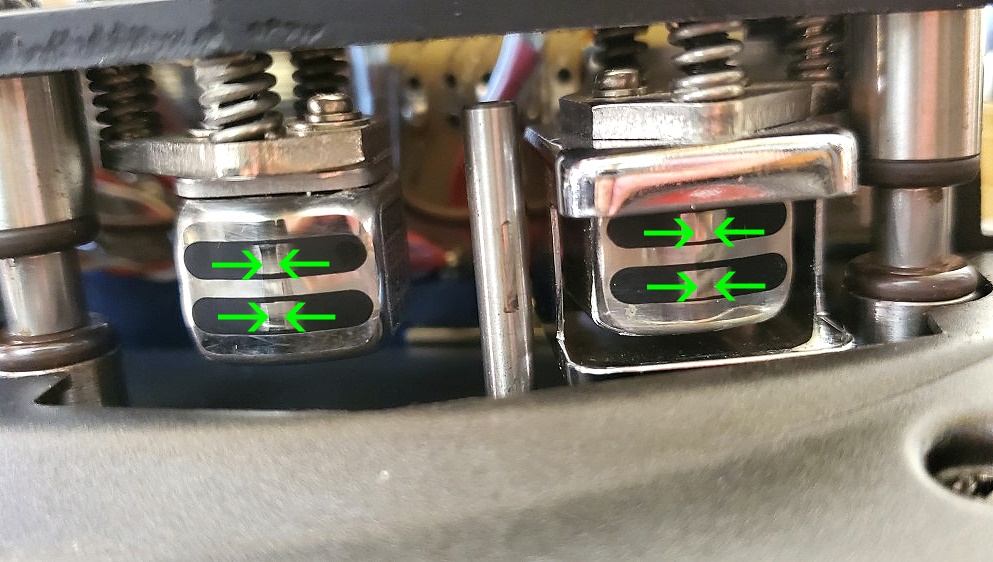
June 3, 2021 – The head stack on the Otari MX-505-B-III-2 needs to be cleaned. You can see debris on the guides (green arrows) and rollers (red arrows). Two additional photos for clarity are shown as well. I will go over how I cleaned them shortly.

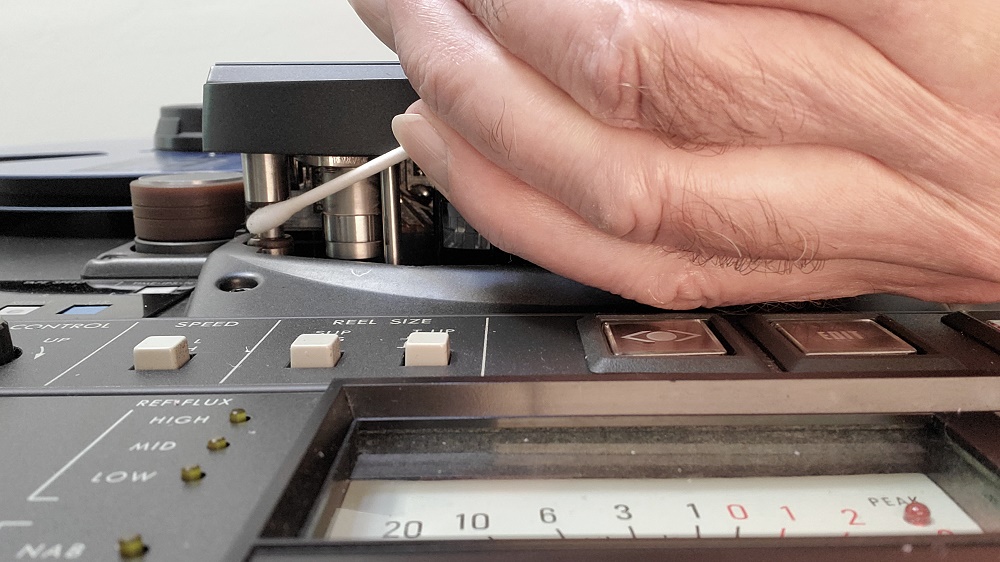
June 4, 2021 – I cleaned the head stack, but I was mistaken as to what was tape debris. I used Q-Tips and 91% isopropyl alcohol. In the photo below, you can see my hand with a Q-Tip cleaning one of the guides.
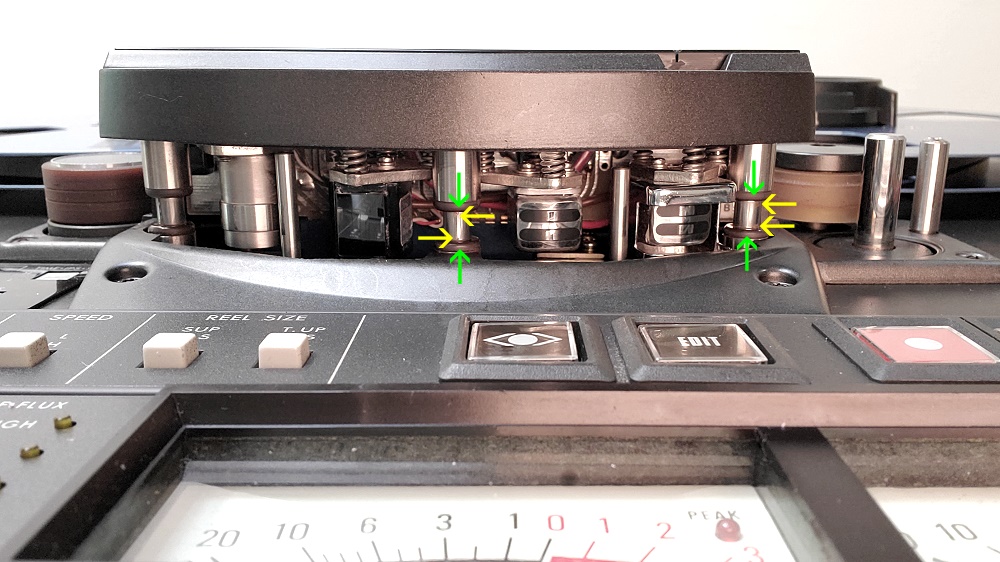
Now, here is a photo after I cleaned the guides and heads. The yellow arrows indicate a bit of tape debris left on the guides. The green arrows point out the top and bottom of the guides. They are the same color as tape debris but are not tape debris. That is just the color of the top and bottom of the guides. This is not proper design. They should be chrome like the rest of the guides so that the user can see if they are clean. This particular photo was taken with flash.
This photo (below) is the same view, but with no flash. A small bit of tape debris is visible on the right guide (yellow arrow), but the debris elsewhere that is visible with flash is not visible with this photo. So, if you are cleaning your head stack, take photos both with flash and without flash for examination. I took these photos by laying my cell phone beneath the head stack on the table with it facing upward in selfie mode so I could see the heads and guides. The deck was vertical on the table. I could not place it horizontally because of the cables connected on the rear panel. After taking the photos, I used my computer with a photo editor to copy each photo and paste it into a new window, then rotated it 1800, and then flipped it horizontally and saved it. If I didn’t do that, it would have been upside down and reversed side-to-side. This would make it difficult to interpret.
Anyway, I needed a lot of Q-Tips to remove all the tape debris, going over each guide several times. The heads were clean. It was the guides that were dirty.
June 6, 2021 – I want to talk about a tape deck factor called “Flux”. It represents the magnetization of the metal particles on the tape. The term used to put a number on flux is Reference Fluxivity, and it is the strength of magnetization that is used to record a signal (music) on the tape at 0 dB VU. The numerical value is the number followed by nWb/m, which stands for nano Weber per meter. Typical values are 185 nWb/m, 250 nWb/m, and 320 nWb/m. Back in the early days of tape, 185 nWb/m was the reference fluxivity that was used because the tape at that time could not be magnetized any stronger than that. And, NAB 0 (the American Standard) was set at 185 nWb/m. But now, 520 nWb/m can be used because tape quality is much better. This is + 9 dB over NAB 0.
On the rear panel of the Otari MX-5050B-III-2, there is a slider switch that is marked “Ref Flux”, and there are three values that can be selected: 185, 250, and 320. At each of these three settings, recording at 0 dB VU will create fluxivity (strength of magnetization of the metal tape particles) of 185 nWb/m, 250 nWb/m, and 320 nWb/m respectively.
I tested this at 250 nWb/m and 320 nWb/m.
Here are the results.
The first graph, shown below, is at 250 nWb/m.
Compare that with the following graph, at 320 nWb/m.

The difference is that increasing the Ref Flux lowers the noise floor by about 3 dB, but the harmonic distortion goes up by about 0.03%. So, you have to choose which is most important to you, the noise or the distortion. For me, it is the distortion, so I have chosen 250 nWb/m as my standard Ref Flux on this tape deck.
June 8, 2021 – When you purchase a used reel-to-reel (RTR) tape deck, one issue you have to deal with is the fact that the heads are worn, unless you purchase a restored RTR that includes heads that have been replaced with new ones or NOS (New Old Stock). Before you purchase a deck, be sure to request closeup photos of the head stack so you can see how much wear the heads have. In the photo below, from my Otari MX-5050B-III-2 RTR, the wear on the heads is indicated between the green arrows. I was very lucky as the wear is minimal. Click on the photo to see a larger version with more detail. It is not always easy to see where the wear region is demarcated (identifiable) since it is a flat area within the shiny chrome surface that contacts the tape, and photography includes reflections on this shiny surface. But, if the photos are taken as a slight angle, the worn surface is more easily detected. If the worn area (it will be flat) is about three times as wide as the flat area shown in the photo below, you may need to have the heads relapped, which means the head stack is removed and the heads are polished to make the surface rounded as the surface was when the heads were new. This can cost several hundred dollars, but it might be necessary if you want the deck to have a good high frequency response. A restored RTR may include head relapping.
Here are some drawings that show various types of head wear you might encounter.
June 12, 2021 – One of the things you need to know about when using a tape deck is the head alignment. Presumably, if you buy a deck that has been serviced before the seller sends it to you, the heads have been aligned. It is important because if the heads are not aligned, wear can be uneven as shown in the diagrams above. Secondly, if the azimuth is not correct, the signal on the left channel will be out of phase with respect to the right channel. The azimuth is the vertical angle. The left channel tape head gap should be exactly in line with the right channel head gap, vertically.
The azimuth is tested by recording and playing a sine wave, such as 1 kHz, in both channels and adding the outputs of both channels together. If the head gaps are aligned, the result will be a peak that has exactly twice the voltage of one channel, assuming that both channels have the same output voltage. This can be tested by using an oscilloscope, but it can also be tested using audio software that allows you to add both channels together. The latter is what I did to test the head alignment on the Otari MX-5050B-III-2 tape deck that I purchased recently.
So, here are the results using a 1 kHz sine wave in both channels.
First, I connected the sound card outputs to the sound card inputs and added the two channels together. The resulting peak is at 14.5 dBV.
Next, I set a 0.5 msec delay for the left channel, which made the left channel 1800 out of phase with respect to the right channel. The peak (shown below) was now at -42.13 dBV which is only a few thousandths of a volt. This is the point of maximum cancellation due to the out of phase waveforms. The reason there is still a peak is because the outputs of the two channels are very close, but not exactly the same. When I set the delay more or less than 0.5 msec, the peak was higher than -42.13 dBV because the left channel was only partly out of phase. This is to demonstrate that having the two channels out of phase causes the peak from adding the outputs of the two channels together to be lower than the peak when the two channels are exactly in phase.
OK, so let’s look at the spectrum from the Otari tape deck source monitor when I input 1 kHz at 0 dB VU (below) and added them together. The output was -2.29 dBV (0.77 Volts) which is twice the output of one channel. The source is in phase for the two channels as it should be.
Now, the spectrum from the 1 kHz tape playback at 0 dB VU (below). The peak is also at -2.29 dBV, indicating that the azimuth of the record and playback head are properly aligned. If the azimuth was not in alignment, the peak would have been less than -2.29 dBV. So, recording and playback with this Otari deck is in correct alignment.

The next step would be to obtain an outside sourced test tape with sine waves recorded on it using a precisely calibrated (azimuth aligned) tape deck. I am trying to find one, but it is not easy.
June 13, 2021 – For a second alignment test, I measured the left plus right channel at 10 kHz. Here is the spectrum for the source. The output was -2.19 dBV.
Now the spectrum from the tape. The output was -3.63 dBV which indicates a slight phase misalignment. However, this may be due to phase shift caused by the EQ that is done to flatten the frequency response. The EQ does not affect the response at 1 kHz and therefore does not cause phase shift at that frequency. However, EQ does affect the response at 10 kHz. The fact that the alignment test showed accurate alignment at 1 kHz but not at 10 kHz does suggest that EQ may be the cause.
I have found a potential source for a professionally produced alignment test tape and am in the process of researching whether or not this test tape will be the one that I need. I will report on this later, but suppose the alignment results shown here are due to phase shift caused by the EQ settings (EQ for each channel is slightly different). Further alignment using a test tape at 10 kHz might throw off the true physical head alignment. That might be fine for recording and playback of tapes made with this specific tape deck, but playback of commercially available music tapes made with other decks would not have proper phase alignment. On the other hand, assuming the test tape was created with no EQ adjustments at all, using the test tape for alignment could produce a proper physical alignment, but with the EQ on my deck, playback could have worse phase alignment due to adjusting the heads based on a tape recorded on a different deck.
July 4, 2021 – Some months ago, I negotiated with an individual who markets copies of audio master tapes to send me some of his tapes to review. I sent him several blank reels of tape so it would not cost him anything but some time to push Play on one deck and Record on the other. He said it would take a week. Time went on, and excuse after excuse, no tapes. It was months ago that he agreed. Last week, I told him to forget the project as I no longer trusted him. I did not hear from him again, even to ask if I wanted him to return the $150 worth of blank reels of tape. So, my experiences thus far with buying used tape decks and associated items have resulted in 90% failures in obtaining what I had expected to obtain, including two decks that had been advertised as in working condition and which turned out to be defective. The first one was returned for refund. As you might remember, one of the repair guys kept the second deck for six months with no repairs. The second repair guy, whose address is listed in one of the posts above, did a great job and repaired the deck in a week, stating that the parts were generic and easily available.
My conclusion is that when dealing with an individual whom you do not know, and with whom you are considering doing business to purchase a used product over the Internet, such as a tape deck, probably expect that 60% (conservative estimate) of the time, you will not get the quality you expected. When considering purchase of a deck, request closeup photos of the tape heads. Look for wear (a flat region at the center of the heads) and cleanliness (lack of brown tape debris). Also request to see a video of the various tape functions in action, including record, play, fast forward, and rewind. When in record and play, make sure you can see the meters responding. Ask to see a record/playback frequency response curve at 7.5 IPS (0 dB VU and minus 10 dB VU), and, if 15 IPS is a speed on that deck, the response curve for that speed too. Ask for a written confirmation that the deck has been cleaned, lubricated, and calibrated if it is stated that the deck has been serviced, refurbished, or restored.
January 12, 2022 – I purchased a second Otari deck a couple of months ago, but this one is a newer model, the MX-5050B-Mk-IV-2. It sat in my lab for awhile as the holidays kept me busy elsewhere, but now that those days are behind, I got down to setting the deck up and testing it.
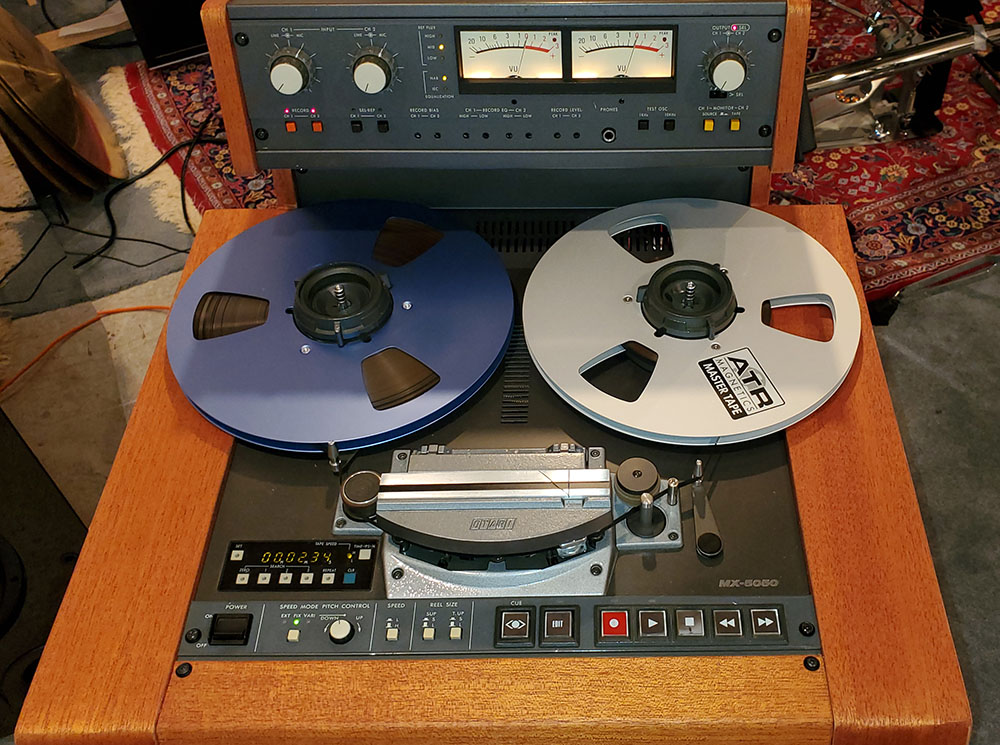
It is similar to the Mk-III-2, but the meters and their controls are on a vertical panel at the top of the deck. There is also a higher Ref-Flux setting which I will get into later.
To start off with, I measured the Frequency Response off the tape before any calibration. Here are the spectra for the left and right channels at 0 dB VU recording level.
You can see that the FR is down 4 dB from 40 Hz to 20 kHz. That is not very good, but one has to calibrate a deck for the particular tape you are using, which for me is ATR Magnetics Master Tape. So, I will do some calibrating, which includes adjusting the tape bias as well as EQ, and will show you the results once I have them.
January 13, 2022 – Here is the left channel off the tape after some initial calibration (Calibration 1), adjusting bias level and EQ. It is now ± 1 dB 20 Hz to 20 kHz. However, there is a bump at 35 Hz that I could not reduce by using the low frequency EQ adjustment pot, so I will need to go into the internal electronics to adjust the range of this EQ pot. Assuming I can do that, I will have a 20 Hz – 20 kHz ± 0.5 dB frequency response which is excellent. Distortion stays at a total of about 1% throughout. Note that this is at 15 IPS. Using 7.5 IPS will reduce the high end frequency extension considerably.
And, the right channel. A little flatter, but faster roll-off above 10 kHz, such that the response at 20 kHz is 2 dB lower than for the left channel. The frequency response needs some more work.
The heads look about the same as on my Otari MX-5050B-Mk-III-2, perhaps a bit more wear, but not enough to cause the poorer frequency response on the Mk-IV-2.
![]()
Here is the Frequency Response and Distortion for the Source.
You can see that the Frequency Response is within about 0.3 dB out to 20 Hz, but drops 1 dB at 30 kHz. Distortion is a bit lower in the right channel. The sampling rate for this test was 24/96 so there is no response beyond 48 kHz.
January 16, 2022 – I have been curious about how good the old cassette tape recorders were. I had one and I liked it, but in those days (1970’s), I was not into THD+N and Frequency Response. I gave my cassette deck away, but I see that they are making a comeback. Since I don’t have a cassette deck, I can’t do any bench tests, so I asked our resident electrical engineer, Dr. David Rich, about how well they actually performed. Here is the correspondence:
JJ: I had a cassette recorder once, but I gave it away a long time ago. It sounded excellent.
DR: Not on the bench. The best were dreadful things. Sales and development stopped in the early 90’s as it was clear how bad they were re. CDs followed by the CDR.
JJ: At 1-7/8 IPS, it must have had some compromises compared to RTR at 7-1/2 and 15 IPS.
DR: It’s a bicycle compared to a race car. Wow and flutter are much lower as expected from the size of everything that moves the tape. The cassette was 1/8 inch wide, so the tracks were half size. Add 3 dB noise.
Two things made it less than dreadful. Dual capstan drive which stabilized the tape and allowed the 2nd innovation, the pressure pad pusher. The cassette had a pad in the central slot that was to hold the tape to the head. A single motor approach with no spool real tension.
Some smart guy figured out how to get the erase head in one of the tiny holes on the cassette, so the record and play heads would fit in the big one.
Azimuth (vertical alignment of the heads) was way out. The plastic that held the tape in place was not that accurate. Kiamichi had some sort of mechanism to compensate, but I do not recall how it worked since the tape had no azimuth tone at the front of tapes as pro tape would
Dolby B got rid of enough noise to match 3.75 IPS 1/4 track. Dolby C took that to 7.5 IPS, but it was basically for Dolby B units, and you could hear it working. Dolby SR came in the late 90’s as a CD-R fighter. It was better but far too late.
THD was just awful. They tested cassette decks at –20 dB reference level while 7.5 IPS was at –10 dB reference or 0 dB reference.
JJ: High frequency extension is directly related to the small gap size in the heads. To reach 20 kHz, the gap would have to have been 1/4th the width of a head at 7-1/2 IPS.
DR: No free lunch. Reduced gap size does improve the high frequency performance at 1.75 IPS but only at –20 dB reference.
In reducing gap size you make low frequency performance worse. It takes on an oscillatory form going up and down. They call it head bumps. As the speed of the tape goes up for a given head gap width the head bumps get worse. So the gap width for a 15 IPs machine is wider to minimize the head bumps while still getting past 20 kHz.
For 30 IPS recording, they way they got noise down before professional Dolby A, the large head bumps are below 100 Hz.
Professional Dolby A is a hugely complex four-band system. Consumer Dolby B/C were toys. Add the dramatically lower wow and flutter, distortion performance, max level to 1% distortion and Dolby A and you are at digital quality levels.
If you still had your cassette deck next to your Otari this would all be very clear sonically, but the Otari spec sheet alone makes the case very clear Cassette was a toy, but consumers loved the toy. The decks were so much smaller, no tape threading, much cheaper tape of very high quality (a cassette does not use much tape compared to a reel-to-reel).
It was not until home MD (Mini-Disc) appeared (with CD-R about a year later) did I stop using my reel-to-reel to record live on tape concert performances on classical FM stations. Cassette was an option for me in the 90’s for less important performances. The tape cost was so much lower.
My 90’s Yamaha top-of-the-line cassette deck is having a belt problem. Nobody will to fix cassette decks now. It is a big problem since I did not archive all the cassettes to digital. Tascam sells (and I purchased at $800) a new deck for pros with the same issues, but the transports are very very cheap units made for portable cassette players. The performance of those transports is so bad, Dolby pulled out Dolby B saying the decks’ performance did not achieve a minimum quality standard. The real reason is the ICs used for the Dolby B system were discontinued long ago.
David Rich
January 17, 2022 – For magnetic tape audio, the low-end frequency response is determined by the tape head pole length and contact face width. Very low frequencies require a long pole length. The higher the tape speed, the longer the pole length has to be to record the low frequencies. That is why the low-end frequency response at 15 IPS is not quite as good as at 7.5 IPS. (The diagram below has been modified from the original.)
The high-end frequency response is determined by the gap width and the type of tape being used. Gap wear reduces the high-end frequency response. In the diagram shown below, you can see that when the wavelength gets shorter (with increasing frequency), and finally is the same as the width of the tape head gap, there is no longer any output. When the + and – peaks of the positive and negative portions of the waveform are the same width as the tape head gap, that is the maximum high frequency, with higher frequencies response decreasing rapidly.
One of the ways that tape recording technology is used to make recordings better is the use of bias. This consists of a high frequency sine wave applied during the recording process. The bias frequency is far out of the range of hearing, typically from about 80 kHz to 160 kHz. The bias increases the ability of the iron particles on the tape to be magnetized by the recording head.
Here is the oscilloscope waveform of a 40 kHz sine wave (I used this frequency for ease of viewing; this frequency is too low to actually be used as bias):

Here is the waveform of a 1 kHz sine wave as a sample of music that might be recorded:
Now, here is the waveform of the combination of the 1 kHz music sine wave and the 40 kHz bias frequency sine wave:

During playback, the 40 kHz sine wave bias frequency is removed using an L/C (inductor/capacitor) notch filter so that only the 1 kHz music sine wave would be played through the output.
Modern tape recordings played on classic tape decks sound, to me, better than any other source I have heard. The precaution is that you need to choose your tape sources carefully. Tapes from decades ago were recorded at very high speed on cheap tape. They are usually 7.5 IPS and some are at 3.75 IPS. They will not sound as good as the two tapes I have reviewed here.
Why does tape sound better than digital? Well, keep in mind this is just my opinion.
Analog music is represented on tape and vinyl by a continuous voltage throughout the waveforms. Digital music is represented by a series of samples that represent voltages on the waveform. The samples are coded by a series of 16 or 24 (32 is the latest) bits that represent the voltages. Shown below is a bitstream, voltage vs. time. The bits are either 0’s or 1’s, and a 0 is coded by a specific length of time as 0 Volts, while a 1 is coded as 5 Volts (other voltage values are sometimes used, such as 1.8 Volts).
During recording, Analog-to-Digital Conversion (ADC) is used to encode the musical waveform, as shown below in the top portion of the figure. The dots on the waveform are the samples. During playback, Analog-to-Digital Conversion (DAC) is used to decode the digital bitstream into an analog waveform (bottom of the figure shown below).
Notice that the decoded signal is not a true representation of the original musical waveform. Mathematically separating out the frequencies in this waveform gives a large number of harmonics that were not in the music. So, the signal is filtered, removing as much of these harmonics as possible, leaving only the original frequencies. This is not a perfect procedure. For 20 kHz, there are only two samples for each complete waveform using 16/44.1 sampling. The result is a huge number of harmonics in the decoded waveform. That is why a strong low-pass filter is used at 22 kHz, which removes (reduces) the harmonics at 40 kHz, 60 kHz, etc. At 10 kHz, there are four samples. That also decodes to a signal that has harmonics. The filter does not remove the 20 kHz harmonic but does reduce it somewhat due to the low-pass filter not being a straight up and down wall.
Let’s take 5 kHz. It has eight samples. The decoded signal still has harmonics. The 2nd ordered harmonic at 10 kHz and 3rd harmonic at 15 kHz are not removed. The harmonics are small, but still, they are there. There are also quantization errors and jitter. With increased sampling frequency, the harmonics are less because there are more samples, but the decoded waveform is never a perfect representation of the original. Just, very close.
The advantages of digital are that perfect copies can be made so there is no sequential generation degradation. Digital also has somewhat lower distortion and lower noise. With the DAC chips being so terrific these days, the really important part of the DAC is the analog output stage. Keep this in mind when purchasing a DAC. A really inexpensive DAC will not have a strong output stage that can drive a preamplifier if the preamp does not have a high input impedance.
Anyway, regardless of all the arguments about analog vs. digital, this is what I prefer. I do listen to a lot of digital music because that is what is mostly available. Analog music products are a very small percentage of recorded music. Also, like vinyl, using tape is very inconvenient. You have to rewind the tails-out tape to play it. Cueing to a particular track is easy with digital and vinyl, but not easy with tape. Vinyl and tape require mechanical contact with the sensor (stylus or tape head) so the sensor and vinyl and tape wear with use. I use a streaming service and love to listen. Digital sounds great. But tape sounds better (to me). So, I now have both and will enjoy them both.
January 19, 2022 – I took a look at the user manual for the Otari MX-5050B-Mk-IV-2 deck, and it includes maintenance information that is for use by engineers, not consumers. There are bias and EQ pots on the front of the deck, and consumers can use these to adjust the amount of bias as well as High Frequency EQ and Low Frequency EQ for the recording process. There are also some EQ pots inside the chassis for use by the engineers. They adjust the EQ for playback. Factory engineers adjust these pots for playback EQ, and consumers are not supposed to adjust them. The high frequency roll-off at 20 kHz on this deck may be due to the previous owners adjusting the internal pots because of the limitations of FM radio transmission where 15 kHz is the highest frequency that can be modulated. I will need a test tape with a complete frequency response sweep from 20 Hz to 30 kHz to test this and make any adjustments necessary to obtain a response out to 30 kHz as I have with my other Otari deck, the MX-5050B-III-2.
January 28, 2022 – As with the Otari MX-5050B-III-2 deck that I have, the Otari MX-5050B-IV-2 deck has a choice of NAB or IEC (IEC is also called CCIR) EQ. NAB is the American EQ, while IEC is European. Commercial music tapes are available with both types of EQ, and you may not have a choice, so being able to switch the EQ on the front panel of the decks is very handy. Here is a graph of the playback EQ for both types. Note that IEC has more post-emphasis in the low frequencies as well as the high frequencies than NAB EQ. Note also that the NAB tape playback EQ is similar to the RIAA phono preamplifier post-emphasis curve. The output of a tape head is also similar to the output of a phono cartridge. It would be interesting to plug a playback tape head directly into the input on a phono preamplifier.
