

I reviewed the SVS PB16-Ultra Subwoofer back in 2021. It was, and still is a great sub. They are on closeout sale at Emotiva, for as long as they last.
Fast forward to 2024, and I reviewed the SVS PB17-Ultra R|Evolution Subwoofer. It’s really good too.
I received requests to compare the two subs.
So, I retested the PB16-Ultra along with more tests of the PB17-Ultra R|Evolution. Both subs were installed into my home theater, side-by-side a few feet apart. They were both near a back wall. I wanted to see what the drivers could do, without any effects from the ports, so I placed my calibrated microphone on-axis, pointing at the center of the driver cone, at a “near-field” position, namely at the same vertical plane as the outer edge of the driver’s rubber surround. This prevented any room effects from creating false response data. I removed the grilles because they are very different from one another. The PB16-Ultra has a metal grille, and the PB17-Ultra R|Evolution has a cloth grille. All of the phone app options were either in their default position (such as “Polarity”) or disabled (such as “Parametric EQ”).
For the PB16-Ultra, the amplifier has one channel with 1,500 Watts into the 4.5 Ohms single voice coil. For the PB17-Ultra R|Evolution, there are two 1,400 Watt amplifiers that drive two individual, separate 3.1 Ohms voice coils. This resulted in having to use 37.2 mV input signal voltage for the PB16-Ultra, and 189 mV input signal voltage for the PB17-Ultra R|Evolution to produce the same dB SPL output. Both subs were set to -10 dB on the volume controls. So, the PB17-Utra R|Evolution subwoofer has lower sensitivity. This is not a relevant issue since getting 0.2 Volts output from your surround sound processor is easily accomplished.
Here are the results. Each pair of spectra has the PB16-Ultra first, followed by the PB17-Ultra R|Evolution. I set the output volume to be about 100 dB SPL on each subwoofer, then kept the input voltage the same for the remainder of the tests. The output at near-field was about 10 dB SPL louder than at 1 meter.
Secrets Sponsor
At 15 Hz, distortion was 8.45% for the PB16 (Figure 1).

Distortion was 2.25% for the PB17 (Figure 2).

The output at 20 Hz is shown in Figures 3 and 4 below. PB16 – 5.28%, PB17 – 1.32%.


At 30 Hz, PB16 – 1.07%, PB17 – 0.24%. Now before you panic if you have a PB16, it should be noted that the distortion for such low frequencies is not really noticeable because our ears are not very sensitive to these frequencies. I have had the PB16-Ultra for three years and have never felt I heard any distortion. Secondly, music does not generally have much energy at very low frequencies, and movie soundtracks with 20 Hz material are for sound effects such as explosions and starship engines, and they are digitally generated, so we would not have the slightest sense of any harmonic distortion.


40 Hz, PB16 – 1.22% and PB17 – 0.16% (Figures 7 and 8).


50 Hz, PB16 – 1.28%, PB17 0.1%. The difference is huge, isn’t it? Also, the 2nd-ordered harmonic is a bit higher in relation to the 3rd-ordered harmonic in the PB17.


60 Hz, PB16 – 1.13%, PB17 – 0.14%.


80 Hz, PB16 – 1.78%, PB17 – 0.14%.


And at 100 Hz (Figures 15 and 16 below), PB16 – 1.68%, PB17 – 0.17%.


The Frequency Response is shown below in Figures 17 and 18. They are very similar. The PB16 drops about 5 dB SPL between 20 Hz and 15 Hz, While the PB17 drops about 4 dB SPL.


The distortion plots are quite different between the two subwoofers as shown below in Figures 19 and 20.
, Red (3rd-ordered Distortion), and Blue (4th-ordered Distortion) Lines Graph Diagram")
, Red (3rd-ordered Distortion), and Blue (4th-ordered Distortion) Lines Graph Diagram")
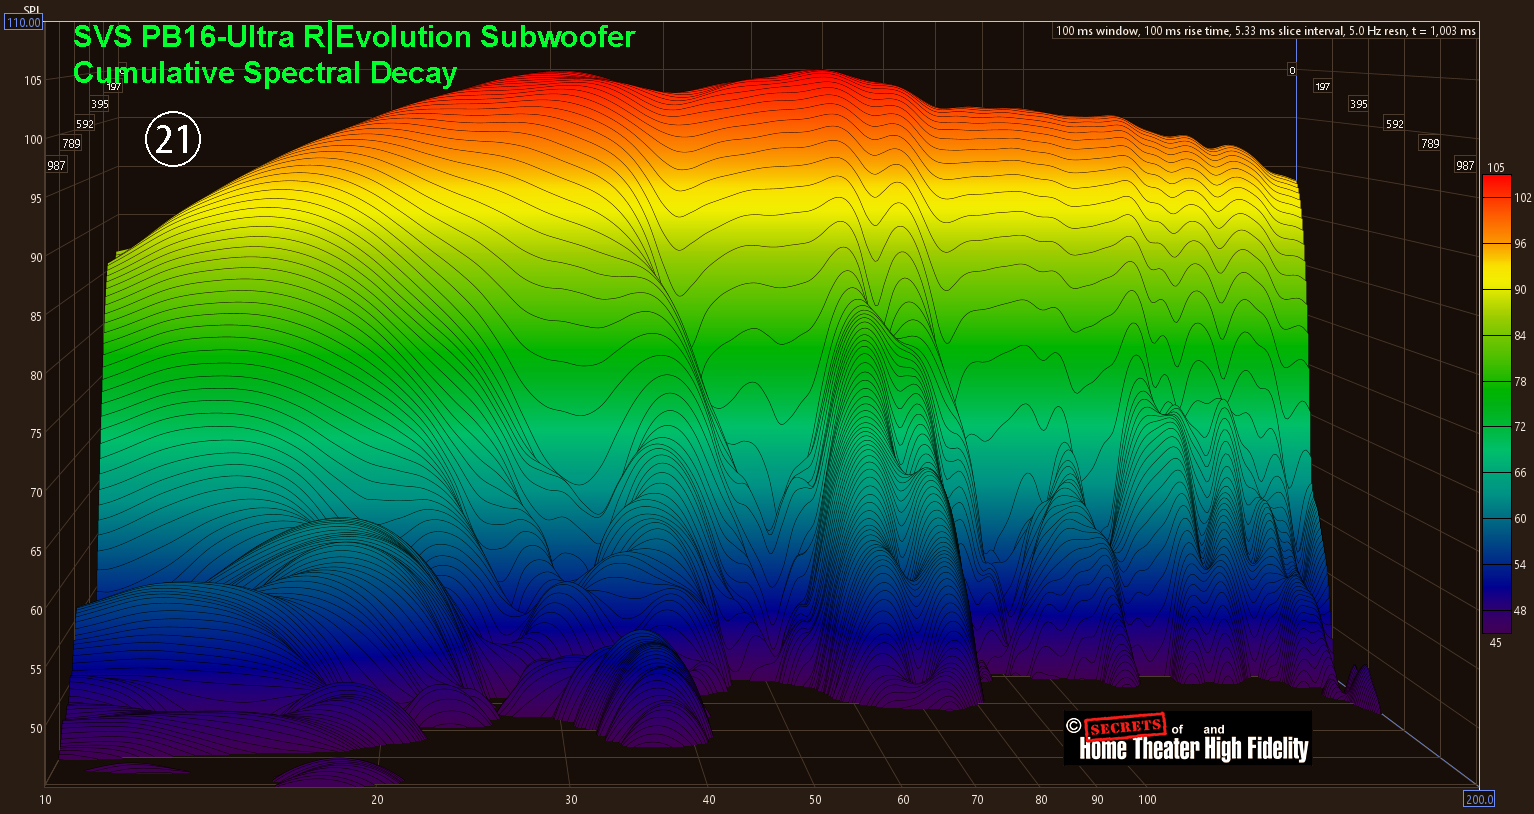
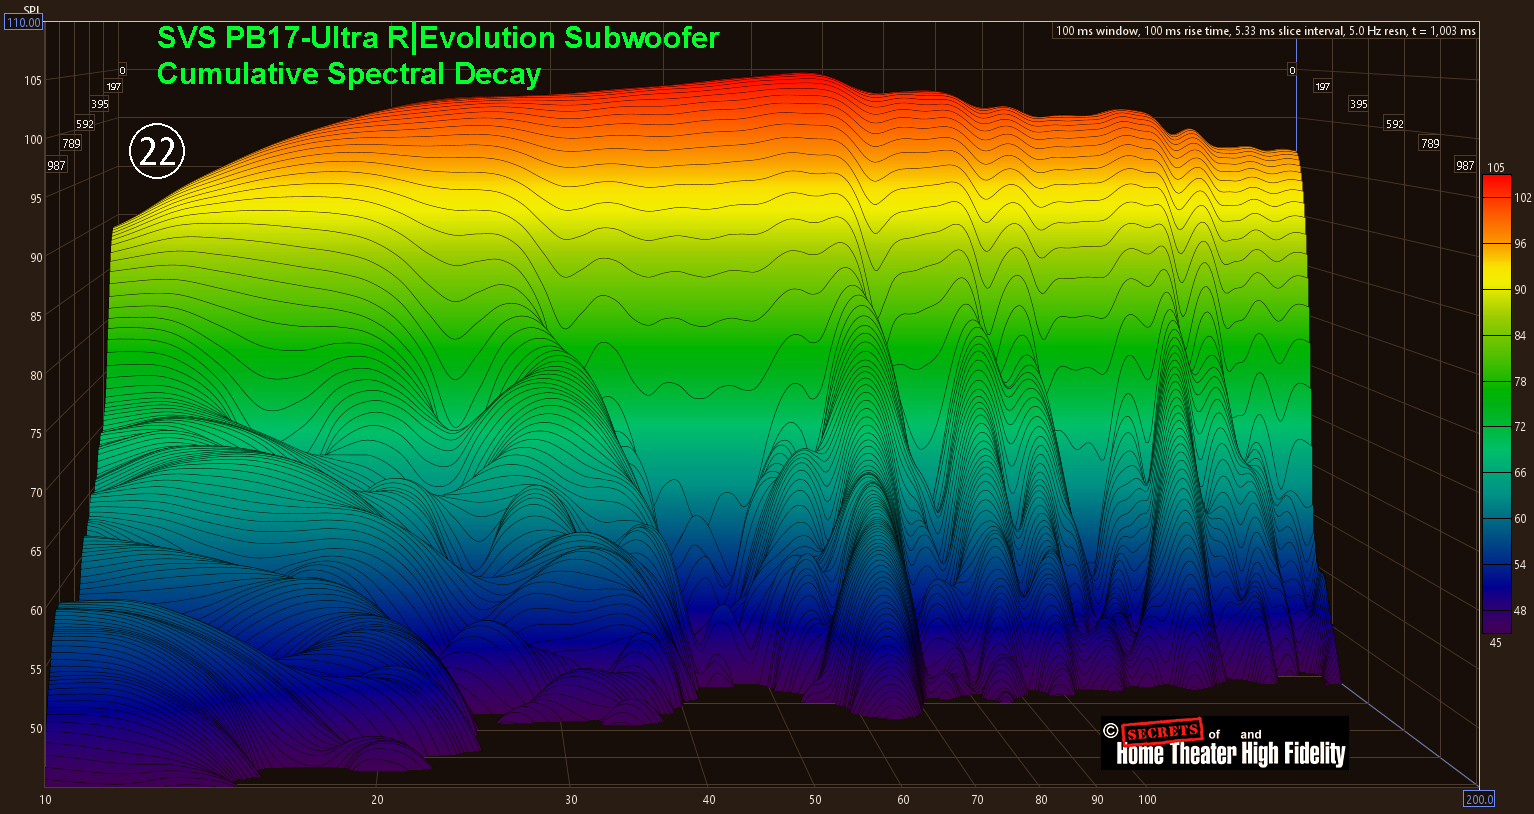
Here are the Cumulative Spectral Decay (CSD) spectra for the PB16-Ultra (Figure 21) and PB17-Ultra R|Evolution subwoofers. The PB17-Ultra R|Evolution has more resonance in the 10 Hz – 30 Hz range because it has a lot more power and a larger driver.
Secrets Sponsor
So, there are the results for the comparison between the SVS PB16-Ultra and the PB17-Ultra R|Evolution Subwoofers. Even though distortion is more prominent in the PB16-Ultra, I don’t see it being a problem at all because the harmonics are also very low frequencies.
