Benchmark Media produces DACs that are primarily intended for audio recording and mastering studios. We reviewed the DAC2-DX some time ago, and they released the DAC3-DX which we review here. It is very flexible in terms of a choice of output voltages. It comes set up for studio use, with a maximum output of 18.3 volts. The studio calibrates it for 12.3 volts output, which is a standard, and is also rated in what is called dBu. The 12.3 volts standard is equivalent to 24 dBu.
The sound is very good, as was the DAC2-DX. The DAC3-DX has a number of improvements, which will be described below.
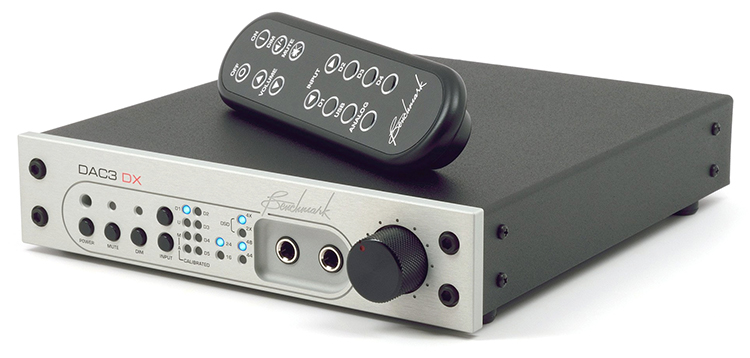
Benchmark Media DAC3-DX Recording and Mastering Studio DAC
- Analog output has low distortion
- Very small footprint will allow easy placement in equipment rack
- Adjustable output using internal jumpers gives choices to match preamplifier input sensitivity
- Many parameters are selectable from front panel
Benchmark Media produces headphones, speakers, power amplifiers, analog-to-digital converters (ADCs), and digital to analog converters (DACs). Their products are designed for recording and mastering studios.
DESIGN:
Digital-to-Analog Converter (DAC)
FREQUENCY RESPONSE:
20 Hz – 20 kHz ± 0.005 dB at 192 kHz Sampling
OUTPUT VOLTAGE:
18.3 Volts RMS MAXIMUM
SIGNAL-TO-NOISE RATIO:
126 dB, Unweighted, 0 dBFS, 27.5 dBu
CROSSTALK:
Minus 120 dB at 20 kHz
JITTER:
< 144 dB
MAXIMUM INPUT SAMPLING:
24/192 kHz PCM, DSD-64
DIMENSIONS:
1.72” H x 9.5” W x 8.5” D
WEIGHT:
3 Pounds
MSRP:
$2,195 USD
COUNTRY WHERE MANUFACTURED:
USA
Company:
SECRETS Tags:
Benchmark Media, DAC3-DX, Digital-to-Analog Converters, DACs, DACs Reviews 2017
The Benchmark Media DAC3-DX is the successor to the DAC2-DX. The differences between the DAC3-DX and the DAC2-DX are (1) active 2nd harmonic compensation, (2) active 3rd harmonic compensation, (3) lower THD+N, (4) lower passband ripple, (5) improved frequency response, (6) faster PLL lock times, (7) faster switching between inputs, and (8) adjustable calibration.
The front panel has a similar array of buttons as the DAC2: Power, Mute, Dim, and Input. There are LED indicators for the input and resolution of the digital signal. Two ¼” headphone jacks and a digital volume control round out the front panel features.
An included remote control has the same controls as the front panel.

The rear panel has a set of analog outputs on the left and digital inputs on the right.
Secrets Sponsor
The inputs include one balanced XLR, two single-ended RCA, two Toslink optical, and one USB. The AC socket is grounded.

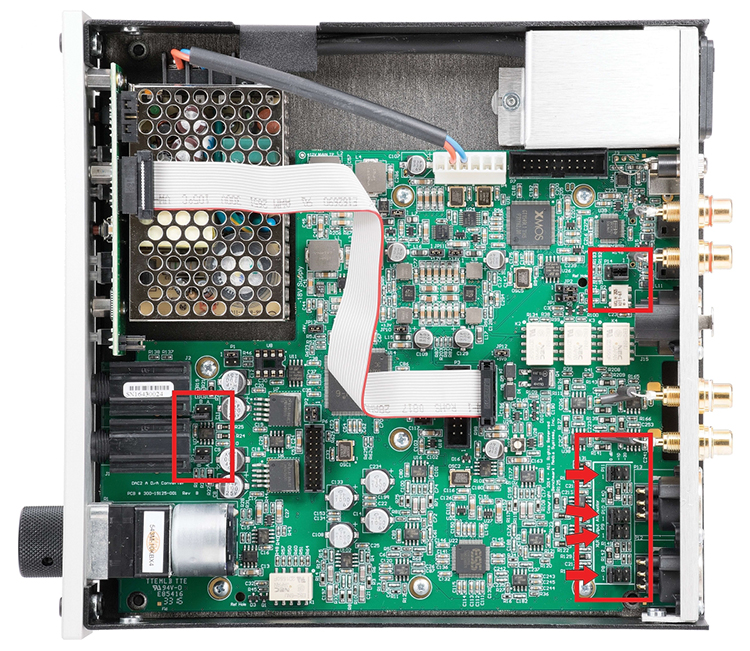
The inside of the chassis is shown below. Using jumpers, seen in the bottom right corner, you can set the output of the DAC3-DX to be three different voltages. Then, the volume control is used to calibrate the output to be 24 dBu (12.3 volts), 14 dBu (3.89 volts), or 4.3 dBu (1.27 volts).
For the listening tests, I connected my computer to the DAC3-DX using the USB input, with the jumpers set for 14 dBu (3.89 volts) output. The software driver has to be downloaded from the Benchmark Media website and installed on a computer. The Benchmark will then be listed as available outputs on your music player. In my case, this is the JRiver Media Center 23. The XLR balanced analog outputs were connected to a Pass Labs Xs preamplifier, Pass Labs Xs-300 power amplifiers, and MartinLogan CLX electrostatic speakers. Cables were Wireworld and Mogami.

Hymn to the Virgin, available from 2L in Norway by download, has become one of my go-to albums, not just because I love it so much, but that I now have all the nuances in the memory portion of my auditory cortex, so I know if anything is missing. Well, nothing was missing.

This Naxos album has Frank Bridge’s String Quartets Nos. 2 and 4, along with the Phantasy Quartet. It includes piano with the strings. The soundstage was perfect, the deep resonant piano tones were wonderful, and the strings were easily separable.

Guitar is a wonderful test for any audio system. The transient peaks that occur when the strings are plucked make the difference between sounding live or sounding like a recording. The DAC3-DX was able to handle all of the transients perfectly in this Linn Records album of Francesco Corbetta’s La Guitarre Royalle.

Hiromi is one of the finest jazz pianists I have ever heard. Her best album, in my opinion, is Brain, on Telarc disc.
Her lightning fast fingers, combined with a fine jazz drummer, were an easy job for the DAC3-DX. If you are a jazz aficionado, you should purchase this album.
For the bench tests, I have moved to using much more sensitive measurements with the Audio Precision because, as I have mentioned in some previous reviews, the distortion is so low, it is beyond the Audio Precision’s capability. So, for the 1 kHz tests, I now will be using a notch filter at 1 kHz, which removes the residual distortion of the Audio Precision. For the other tests, I have refined the measurement procedures as well, although notch filters at two frequencies is not possible with the Audio Precision 2700 series. The downside is that I can only show distortion peaks at a maximum frequency of 30 kHz, so I cannot show peaks all the way out to the Nyquist frequency (1/2 of the sampling frequency) for 96 kHz and 192 kHz. I used the XLR balanced digital input and the XLR balanced analog outputs for all the tests.
The first three tests show 1 kHz at 24 dBu (12.3 volts) output, 14 dBu (3.89 volts) output, and 4.3 dBu (1.27 volts output), with 16/44.1 sampling, and a 0 dB digital input signal. These three output voltages are selectable using internal jumpers. They are recording and mastering studio standards (the 12.3 volts output is used when the cables in the studio are long).
They are set at the studio using a 1 kHz digital input signal at 0 dB (the maximum digital input signal setting) and turning the volume control down until the output reads the preferred dBu or voltage. I found that the volume control setting for the various dBu measurements was at the same place, with the red dot of the volume control turned to about 2 o’clock. The 4.3 dBu should actually be 4 dBu, but with the review unit, it read 4.3 dBu. I initially calibrated the DAC3-DX for 24 dBu with a 1 kHz digital input at 0 dB and left it that way for all the subsequent tests.
The scale on the spectra (graphs) is set to 0 dBr, which means that it is set to a reference voltage level. So, for the first spectrum, 0 dBr is 12.3 volts, for the second spectrum, 0 dBr is 3.89 volts, and for the third spectrum, 0 dBr is 1.27 volts. This is a change from what I used to show, which was in absolute terms, where 0 dBV was always 1 volt. For the 12.3 volt (24 dBu) adjustment, I turned the volume control down until the output voltage on the Audio Precision read 12.3 volts.
You can see that the distortion products (peaks) are very small at the 24 dBu jumper setting (12.3 volts – Figure 1, below), with second and third harmonics at minus 120 dBr, which means that the peaks are 120 dB below 12.3 volts. With the 14 dBu (3.89 volts) jumpers (Figure 2, below), and also with the 4.3 dBu (1.27 volts) jumpers (Figure 3, below), the peaks are the same as with the 24 dBu (12.3 volts) jumpers.
Note also that there are peaks outside of the 22 kHz limit of 44.1 kHz sampling. This is due to distortion in DAC chipset or in the op-amp that amplifies the analog signal which is the output from the DAC chipset. The noise level is higher in the audible band because that is where the dithering is applied. The noise level is at minus 130 dBr. This is not the noise floor, but rather the noise level which is processor gain.
I only changed the jumpers to get the spectra at 24 dBu, 14 dBu, and 4.3 dBu. I did not re-adjust the volume control for each of these dBu settings. For consumer use, only the 14 dBu and 4.3 dBu settings are appropriate. If you purchase this DAC, the first thing you need to do is change the jumpers to the 4.3 dBu setting and see if it is enough voltage to drive your preamplifier or surround sound processor to a satisfying volume without having to turn your preamplifier volume control all the way up. If it is not enough voltage, then change the jumpers to the 3.89 volts setting. Don’t use the 24 dBu jumper setting, as this could damage your preamplifier. Also, do not use the DAC with the DAC volume control turned all the way up, using any of the jumper settings, as this could overdrive the output op-amp.
Click on images below to enlarge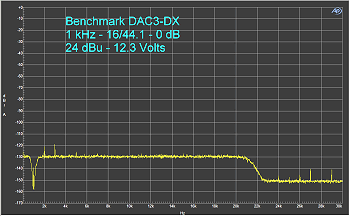
Figure 1
Click on images below to enlarge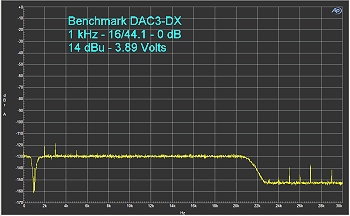
Figure 2
Click on images below to enlarge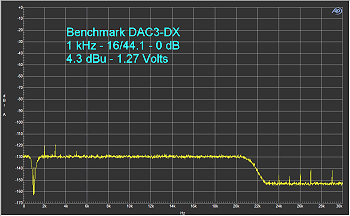
Figure 3
Figure 4, below, shows a 1 kHz test signal at minus 5 dB, with 16/44.1 sampling. No distortion peaks are visible in the audible band. (All the remaining tests use the 24 dBu setting, since the unit is a recording studio product.)
Click on images below to enlarge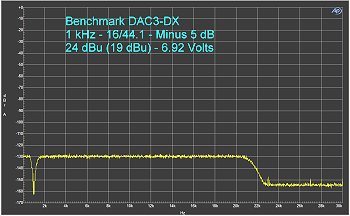
Figure 4
In Figure 5, below, we move to 24/96 sampling. The second and third harmonics seen at 16/44.1 sampling are still at minus 120 dBr, but now, we can see other harmonics that were hidden by the minus 130 dB noise level with 16/44.1 sampling. The harmonics go all the way out to 19 kHz. The minus 150 dBr noise level, beyond 22 kHz, is due to processor gain. It is not the noise floor. There are some hum spurs to the left of the 1 kHz tone, but they are lower than 135 dBr.
Click on images below to enlarge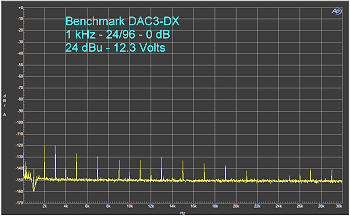
Figure 5
With the digital test signal at minus 5 dB, the distortion peaks are below minus 130 dBr (Figure 6, below).
Click on images below to enlarge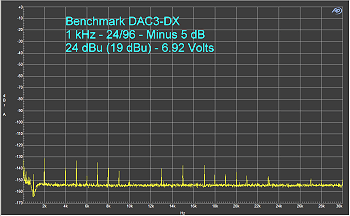
Figure 6
In previous reviews, I used 19 kHz and 20 kHz sine wave combinations to measure the B-A peak at 1 kHz, but also to see peaks adjacent to the test signals, and also, harmonics. Because these new tests can only go out to 30 kHz, I changed the test signals to 9 kHz and 10 kHz. This way, we can see two sets of harmonics, one at the limits of 16/44.1 sampling, and a second set near 30 kHz.
Secrets Sponsor
In the spectrum shown below (Figure 7), the test is at 16/44.1 sampling, with 0 dB digital input level. The B-A peak (1 kHz) is at minus 124 dBr. There are two small side peaks next to the signal peaks, both at approximately minus 120 dBr. There are also harmonics, generally below minus 120 dBr. Note that the voltage is 8.69 volts instead of 12.3 volts. This is due to the Audio Precision handling two input sine wave test signals differently than it does with one sine wave. The dBu for the output voltage is shown in parentheses.
Click on images below to enlarge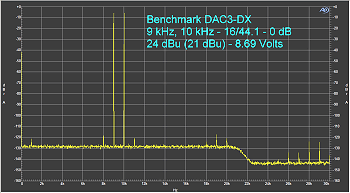
Figure 7
In Figure 8, below, the input signal is at minus 5 dB. Note that there are no side peaks and no visible peak at 1 kHz (the B-A peak). There are some harmonics, but they are at minus 130 dBr and lower.
Click on images below to enlarge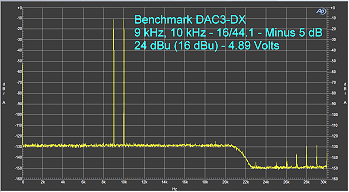
Figure 8
With 24/96 sampling, and 0 dB digital input level (Figure 9, below), the side peaks are more visible because the noise floor is lower (again, minus 150 dBr is processor gain, not the noise floor), but as with 16/44.1, the side peaks and harmonics are at minus 120 dBr and lower. These are not audible.
Click on images below to enlarge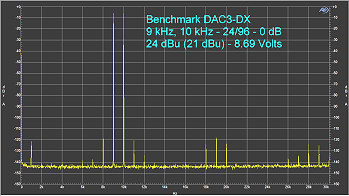
Figure 9
Reducing the digital input signal to minus 5 dB (Figure 10, below), the side peaks and harmonics are at minus 130 dBr and lower. So far, the DAC3-DX is performing very well.
Click on images below to enlarge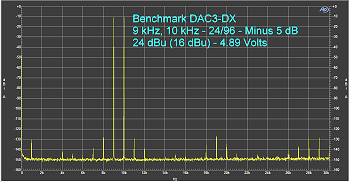
Figure 10
For IMD, I could use the same input signals that I have used before, i.e., 60 Hz and 7 kHz sine waves.
Figure 11, below, is with 16/44.1 sampling and a digital input level of 0 dB. There are some small IMD side peaks next to the 7 kHz sine wave, but no harmonics at 21 kHz. Very small harmonics from the op-amp are present at 28 kHz.
Click on images below to enlarge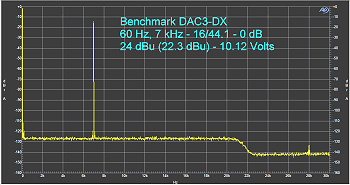
Figure 11
Figure 12, below, is at minus 5 dB. The side peaks next to the 7 kHz sine wave have disappeared, but there are still some small peaks at from the op-amp at 28 kHz.
Click on images below to enlarge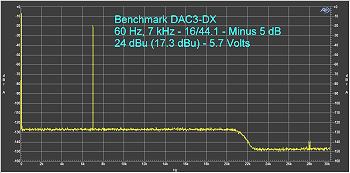
Figure 12
Going to 24/96 sampling, you can see the IMD peaks next to the 7 kHz test sine wave (Figure 13, below). These are not visible in the 16/44.1 test because the noise level is higher there. Harmonics at 14 kHz, 21 kHz, and 28 kHz are also visible.
Click on images below to enlarge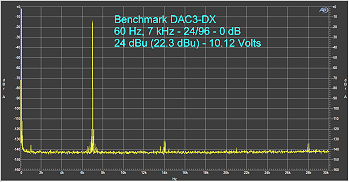
Figure 13
Figure 14, below, is at minus 5 dB input. The side peaks and harmonics are slightly lower than they are at 0 dB input, and they are not audible since they are below minus 130 dBr.
Click on images below to enlarge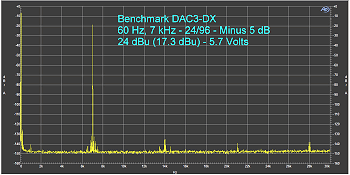
Figure 14
Now we go to linearity. This shows how the output varies with the input. A straight line indicates perfect linearity. Figure 15 below shows linearity with 16/44.1 sampling. The line is straight until it reaches minus 120 dBr. It flattens out there due to the dithering in the input signal.
Click on images below to enlarge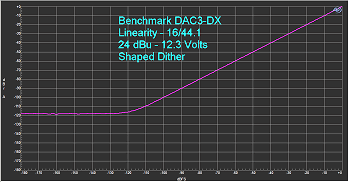
Figure 15
Figure 16, below, is the linearity test with 24/96 sampling. You can see that it is straight until it reaches minus 140 dB, which is the noise level with processor gain.
Click on images below to enlarge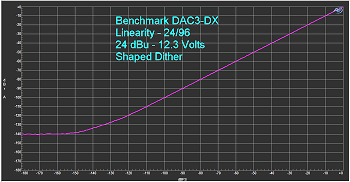
Figure 16
The frequency response at 16/44.1, 24/96, and 24/192 is shown in Figure 17, below. They are all very flat, and roll off near the Nyquist frequency (1/2 the sampling frequency).
Click on images below to enlarge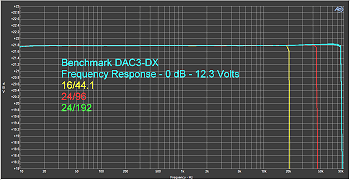
Figure 17
Below, I show two waveforms for time domain measurements. The first one (Figure 18) is at 16/44.1 sampling, with the input set to minus 90 dB. No dither is used. You can see the square waves very clearly. A small amount of pre- and post-ringing is visible.
The second one (Figure 19) is at 24/96 sampling. Note that the waveform is a sine wave, not a square wave. No dithering has been applied. This is good evidence that recording studios should abandon 16/44.1 sampling as the final release format in their recordings. It is an outdated format that was used at the early stage of digital recording because that was the best that could be obtained with the technology that was available back then. Now, with 24 bit-depth and sampling frequencies well above 192 kHz available, studios should be using these higher resolutions. I would suggest 24/48 be adopted as the standard basic entry-level resolution for consumer digital music.
Some studios record at 24/44.1. That resolution should be used for the consumer product, not down-sampled to 16/44.1. For studios recording at 24/96 or 24/192, the music could be down-sampled to 24/48 for release on discs as well as distribution to music streaming services. With FLAC compression, 24/48 could easily be streamed without further compression. The 24/96 and 24/192 versions could be sold as high resolution downloads.
Click on images below to enlarge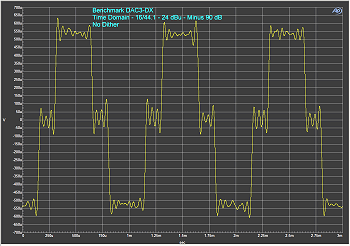
Figure 18
Click on images below to enlarge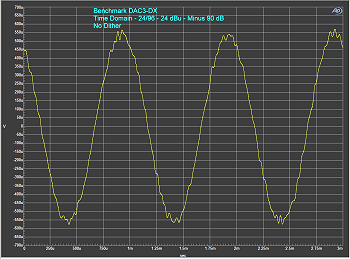
Figure 19
THE BENCHMARK DAC3-DX DAC Is a High Quality Product, Suitable for Recording and Mastering Studio Use, but Also for Consumers, With Very Flexible Setup Controls.
- Clean, low distortion analog output
- Small footprint
- Several output voltages to select from
- LCD readout of voltage and selection of other parameters, rather than pushbuttons
- A red dot at the 24 dBu, 14 dBu, and 4.3 dBu setting on the volume control, for use by consumers
- DIP switches to select voltages instead of internal jumpers


