


Their products are minimalist in appearance, but that ends at the surface. Inside are components that they design themselves, and the performance is beyond, beyond. Even at $110, their D10s DAC is amazing. But their latest iteration, the D900, is setting some standards for performance. The photo above shows the D900 DAC on top and the A900 Headphone Amplifier on the bottom.
Topping D900 DAC
- I don’t know where to start.
- Very low distortion
- Very low noise
- Linear power supply (no wall-wart)
- XLR and USB-C digital inputs (along with the usual ones)
In the world of high-fidelity audio, digital-to-analog converters (DACs) remain the cornerstone of system performance. Regardless of how advanced an amplifier or loudspeaker may be, the sound quality is ultimately shaped by the DAC’s ability to translate digital data into an analog waveform with absolute precision. Low distortion and low noise are not just technical ideals—they directly determine how faithfully the subtle details of music are reproduced, from the delicate decay of a cymbal to the rich harmonics of a cello. For audiophiles, a DAC that minimizes artifacts and delivers pure, transparent conversion is essential for achieving a truly immersive listening experience.
In this context, every new flagship DAC is measured against the giants of the past, and only a few succeed in advancing the state of the art. Topping has already built a reputation for delivering extraordinary measurements at prices that challenge the industry’s expectations. With the release of the D900, the company positions itself not merely as a value leader but as a serious contender for legendary performance. Early impressions suggest that this DAC sets a new benchmark in how digital music can be rendered with lifelike clarity and realism, placing it in direct competition with much more expensive designs.
At the heart of the D900 lies Topping’s newly developed PSRM 32-phase decoding technology, a bold step forward in oversampling and digital signal refinement. By dividing and averaging the conversion process across multiple phases, PSRM reduces noise and distortion to vanishingly low levels, pushing the boundaries of what even the most demanding listener can perceive. Combined with an uncompromising analog output stage and precision clocking, this technology signals that the D900 is not just another high-end DAC—it is a potential landmark in digital audio design.
 sitting on top of a dark television or cabinet; The front panel features a small digital screen displaying a graphic equalizer, the input as USB, and the volume at -30.0 dB; A large black knob is on the right, and the unit has visible horizontal heat sink fins on the side")
; The columns compare the performance of the XLR (Line Out) and XLR (PRE) modes; Parameters include THD+N @A-wt, THD @No-wt 45kBw, SNR @A-wt, Dynamic Range @A-wt, Frequency Response, Output Level, Noise @A-wt, Channel Crosstalk, Channel Balance, and Output Impedance, with corresponding numerical values listed for each mode")
Dimensions:

Weight:
6 lbs.
MSRP:
$1,799 USD
Website:
Company:
SECRETS Tags:
Topping, D900, DAC, digital-to-analog converter
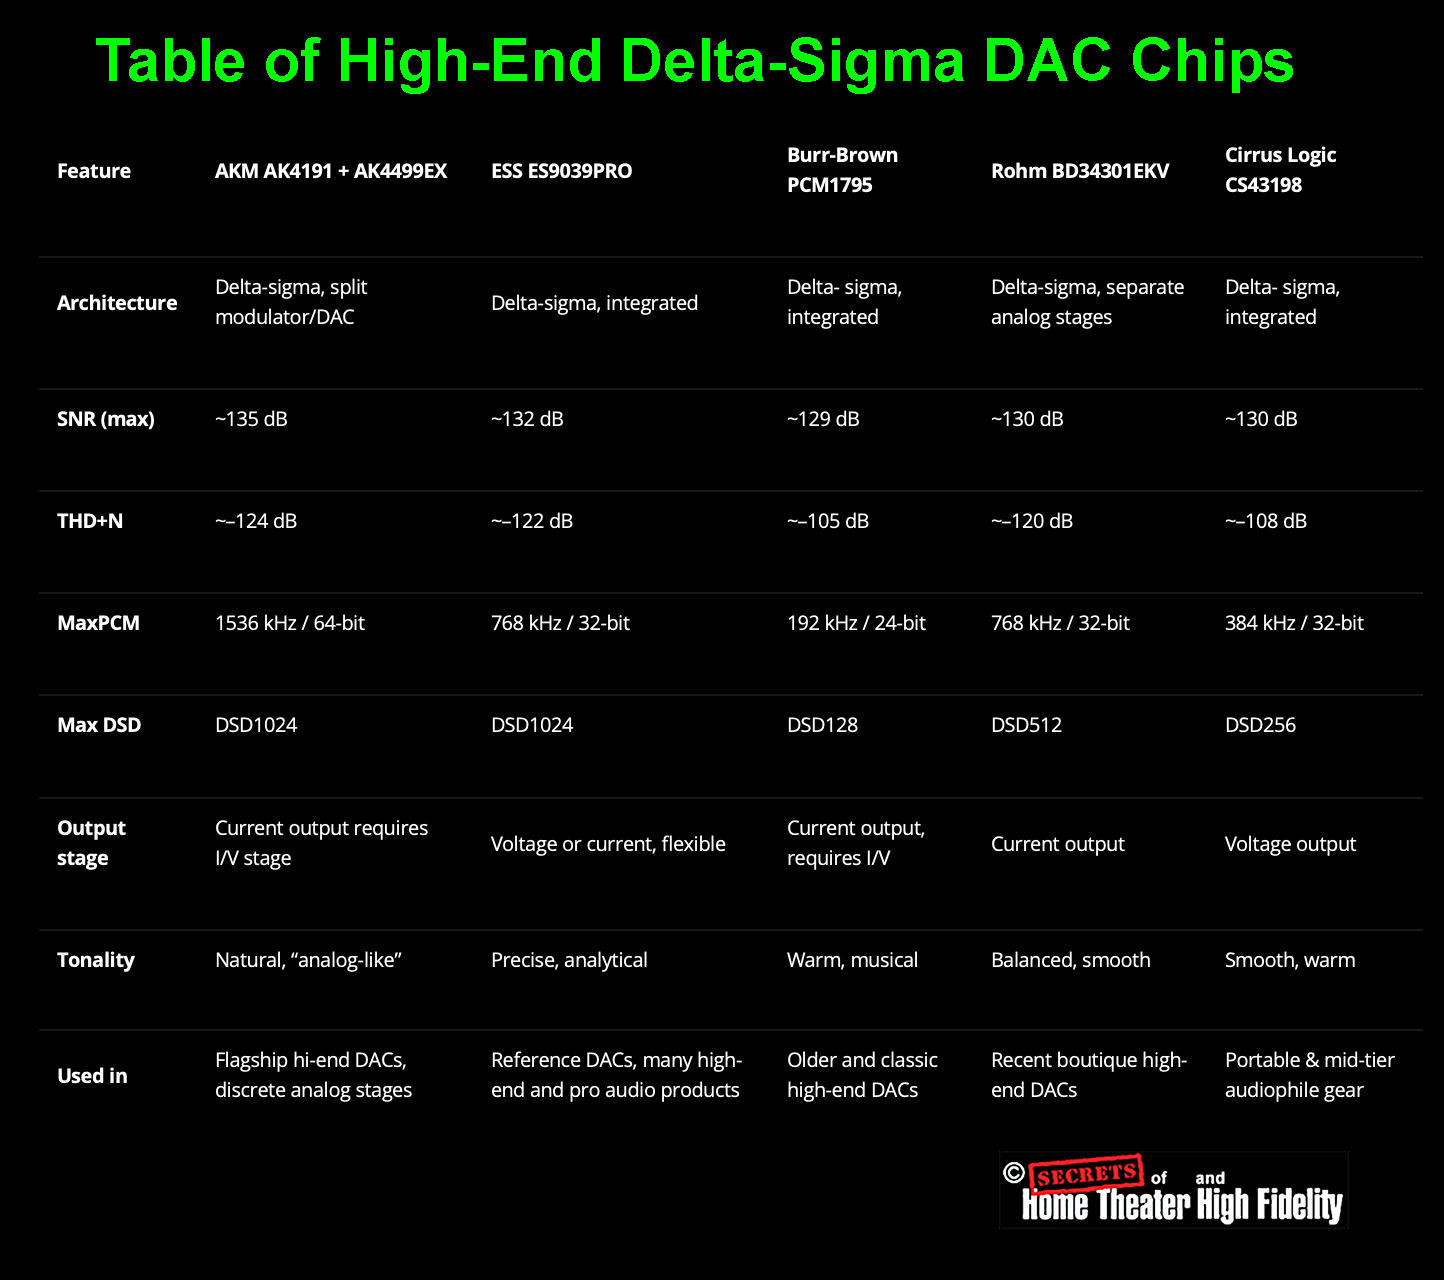
In general, commercial DACs all use the same Delta-Sigma DAC chips because they are produced in huge numbers, so they are not expensive, and they perform at a very high level. Here is a table of the various DAC chips (click on it and use the mouse wheel to enlarge it).
And, here are current distributor prices (USD) for each DAC IC (single unit unless noted):
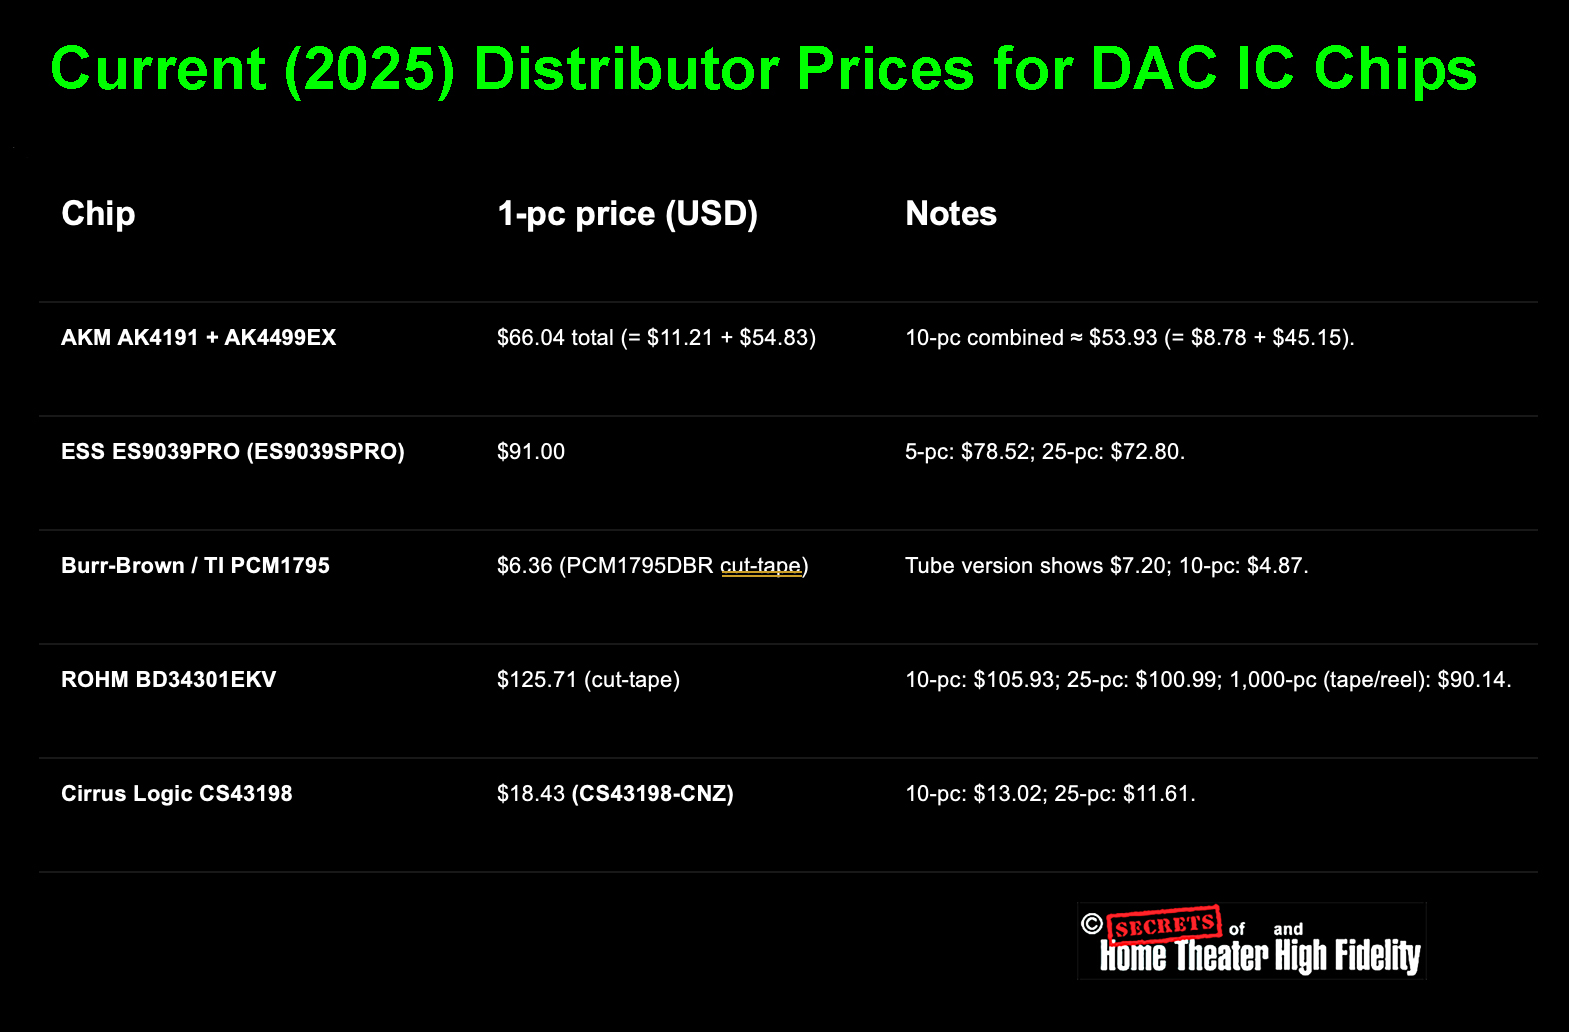
“Tube version” in the above table does not refer to vacuum tubes. It is shorthand for “tape-and-reel packaging”, which is how semiconductor distributors often list parts:
- Cut-Tape – distributor literally cuts a strip of tape from a reel and sells a few chips (good for hobbyists or low-volume).
- Tube – chips are supplied in long plastic tubes (often for DIP or SOIC packages).
- Tape-and-Reel – full reels of parts for automated pick-and-place machines.
So, for the TI / Burr-Brown PCM1795 DAC:
- PCM1795DBR (cut-tape): ≈ $6.36 per chip.
- PCM1795DBR (tube packaging): ≈ $7.20 per chip.
- Quantity 10+ (cut-tape): price drops to ≈ $4.87 each.
Topping designed their own decoding circuit (I don’t think it is called a “chip” at this point).
Overview
● The Topping D900 introduces a proprietary PSRM (Precision Stream Reconstruction Matrix) architecture — distinct from both traditional Delta–Sigma chips and R-2R ladder DACs.
● Its goal: combine the purity of a 1-bit design with the linearity and smoothness of multi-bit averaging.
PSRM: How It Works
● Instead of one 1-bit stream, the D900 runs 32 resistor–switch paths in parallel.
● Each path is slightly time-shifted (phase-staggered) so they don’t all toggle at once.
● Their outputs are then summed and averaged into a single analog value.
● This averaging cancels switching noise, resistor mismatches, and distortion, producing an ultra-clean signal.
● Here is a simulation of the 32 switch paths operating in sequence:

The 32 resistors don’t mean it’s a “32-bit ladder DAC.”
● An R-2R ladder uses binary-weighted resistors, one per bit.
● The D900 instead uses 32 copies of a 1-bit switch, staggered and averaged.
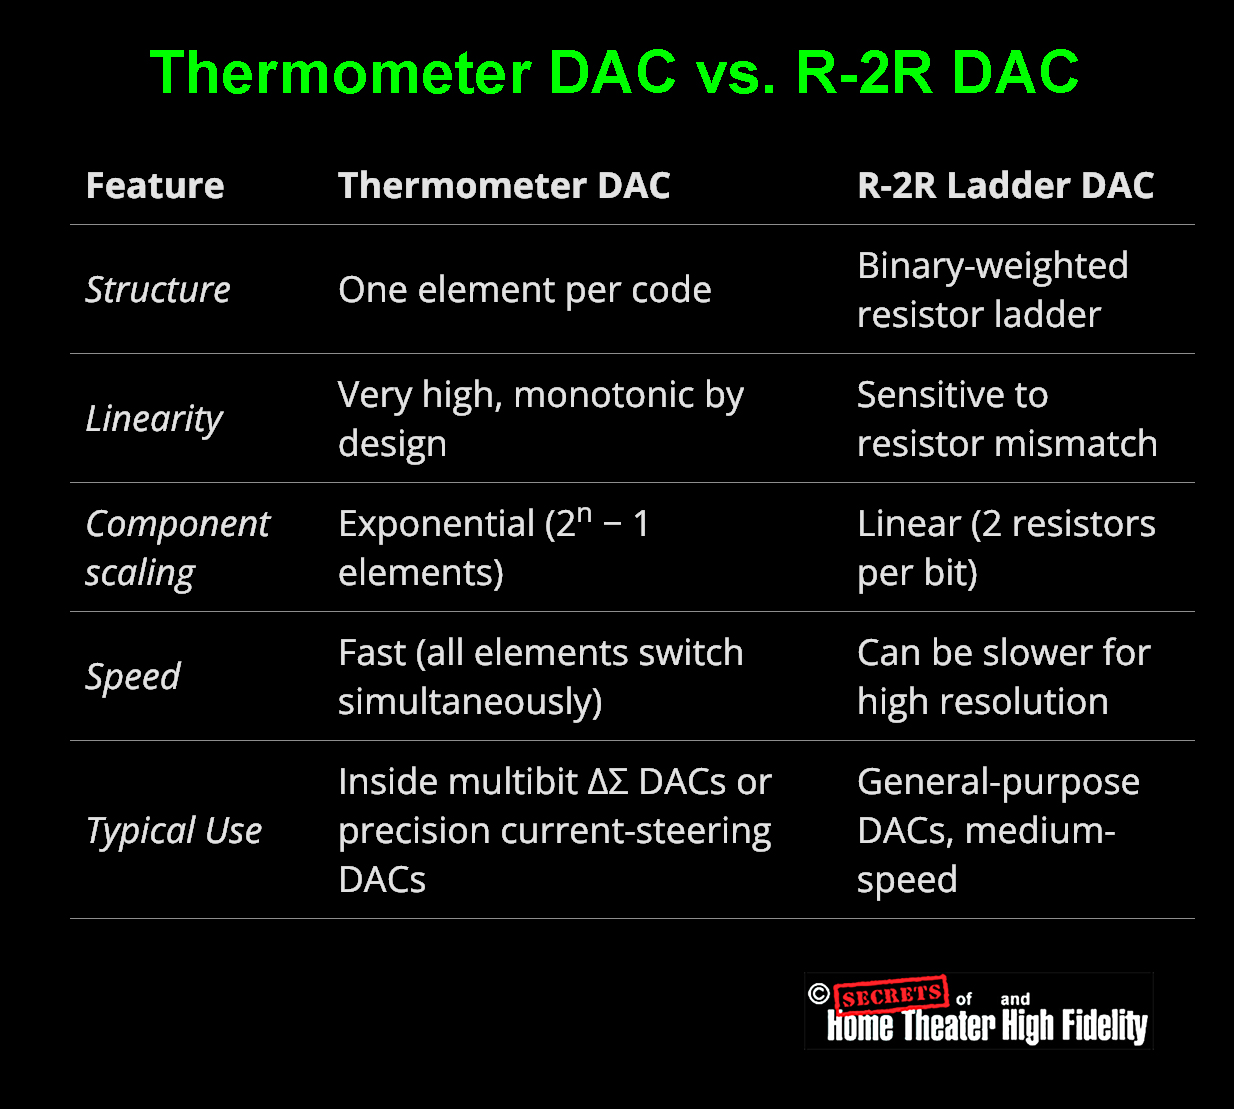
The Topping 900 doesn’t use an R-2R ladder like discrete resistor DACs (e.g., Denafrips). Instead, it uses their variation of a thermometer-coded current-steering DAC core, which offers:
- Better linearity and matching
- Excellent low-level accuracy
- High-speed operation suitable for audio delta-sigma modulators
So, while both R-2R and thermometer DACs are “multi-bit” designs, the thermometer DAC’s architecture inherently provides superior precision at the cost of circuit complexity.
What a Thermometer DAC Is
A thermometer DAC (also called a unit-element DAC or thermometric DAC) uses one identical current source (or resistor) per output step.
Each bit represents one “unit,” not a power of two as in binary systems. The code is represented by turning on a number of identical elements — just like a thermometer rising in discrete steps.
For example, in a 3-bit thermometer DAC:
- Digital code 000 → 0 units on
- Digital code 001 → 1 unit on
- Digital code 011 → 2 units on
- Digital code 111 → 3 units on
…and so on up to 1111111 (7 units on).
Thus, a 3-bit DAC needs 2³ − 1 = 7 identical elements.
Each element contributes an equal share of voltage or current, so the total output is proportional to the number of activated elements.
Why It Has Better Matching
Because every unit uses identical resistors or current sources, the DAC output depends mainly on how closely those elements are matched.
- There are no binary-weighted resistors like in R-2R networks, where small mismatches cause major linearity errors.
- In a thermometer DAC, mismatch errors average out statistically, so it achieves excellent differential nonlinearity (DNL) and monotonicity (the output always increases for a higher code).
That’s why thermometer structures are often used inside high-performance multi-bit ΔΣ DACs and audio DAC chips (e.g., ESS, AKM, TI multi-bit modulators).
Trade-Off: Exponential Growth in Components
The drawback is that the number of elements grows exponentially with resolution:
- 3 bits → 7 elements
- 4 bits → 15 elements
- 8 bits → 255 elements
- 10 bits → 1023 elements
That’s why no one builds a full 16-bit thermometer DAC — it would require 65,535 matched resistors or current sources!
Instead, engineers often use segmented DACs, where:
- The most significant bits (MSBs) use thermometer coding for linearity.
- The least significant bits (LSBs) use binary-weighted R-2R or current scaling.
This hybrid approach balances precision with manageable circuit size.
Here is a comparison of thermometer DACs with R-2R DACs:
How Oversampling Interacts
● Modern DACs oversample the incoming audio (e.g., 192 kHz PCM → internal clock in tens of MHz).
● The D900’s PSRM cycles through all 32 switches multiple times within each audio sample period.
● At 192 kHz with an OSR (Oversampling Ratio) of 128, the 32-phase averaging process completes in ~1.3 μs, while each audio sample lasts 5.2 μs.
● That means several full averaging cycles per sample, reinforcing accuracy.
1. Basic Idea of the Oversampling Ratio
● In a DAC (especially Delta-Sigma or PSRM types), the incoming audio samples (e.g., 44.1 kHz or 192 kHz) are oversampled to a much higher internal switching frequency.
● The Oversampling Ratio = Internal Switching Clock / Audio Sample Rate
2. Why Oversampling Is Used
● A higher switching rate spreads quantization noise into ultrasonic frequencies, where it can be filtered out easily.
● It reduces the demands on the analog reconstruction filter (the low-pass filter after the DAC).
● It allows the use of noise-shaping and averaging (like Topping’s PSRM) to achieve very low distortion.
3. Examples
- OSR = 64 → switching clock = 2.8224 MHz (this is the same as DSD64).
- OSR = 128 → 5.6448 MHz (DSD128).
- OSR = 64 → 12.288 MHz.
- OSR = 128 → 24.576 MHz.
4. OSR in Context
● Delta-Sigma DAC chips (ESS, AKM, TI) typically use OSRs between 64× and 256× depending on mode.
● DSD audio formats are literally named after their OSR:
- DSD64 = 64 × 44.1 kHz = 2.8224 MHz
- DSD128 = 128 × 44.1 kHz = 5.6448 MHz
Summary
● As the sample rate doubles, the switching clock also doubles for the same OSR.
● As OSR increases, the switching clock scales linearly — pushing noise further into the ultrasonic band.
● At the extreme, 384 kHz @ OSR 256 results in nearly 100 MHz switching (see table below), which is the realm of high-performance discrete DACs like Topping’s D900.
, Switching Clock (Fsw), and 32-Phase Averaging Time (μs); It shows how the switching clock frequency and averaging time change with different sample rates and oversampling ratios, listing values for 44.1 kHz, 96.0 kHz, 192.0 kHz, and 384.0 kHz sample rates")
Technical Innovations
● 1-bit purity, multi-path stability: Perfect monotonicity (output never reverses) with low noise and distortion.
● 32-phase averaging: Dramatically lowers THD (– 140 dB).
● Resistive reference system: Isolates switching from the power supply, reducing interference.
● CPLD-based clocking: Manages jitter to extremely low levels (spec’d around – 157 dB).
● Custom I/V stage: Carefully tuned analog output after the resistor array.
Features Beyond the Core DAC
● Full preamp capability: Precision volume control in 0.5 dB steps.
● 10-band parametric EQ: Adjustable through its front display.
● Modern interface: Color screen with VU meters, FFT displays, and remote control.
● Connectivity: Balanced outputs, USB/SPDIF/I2S inputs, plus Bluetooth 5.1 with LDAC/aptX HD.
How It Differs from Conventional DAC Chips
- Use multi-bit Delta–Sigma modulators (3–5 bits).
- Inexpensive, mass-produced, measure well, and integrate DSP/filter features.
- But, still shaped by clock jitter and noise-shaping artifacts.
- Use binary-weighted resistors.
- Known for “analog-like” tone but limited by resistor accuracy.
- Typically max out at ~20–24 bits of usable precision.
- A fundamentally 1-bit design, so monotonic by nature.
- Enhanced by 32 parallel switching phases that cancel out imperfections.
- Aims to combine R-2R’s musical smoothness with Delta–Sigma’s technical perfection.
The Topping D900’s PSRM circuit . . .
● Stays true to the 1-bit concept (perfect monotonicity, DSD-like purity).
● Uses 32 staggered parallel paths to smooth, average, and cancel distortion.
● Runs this process multiple times per audio sample thanks to oversampling.
● Delivers ultra-low THD and noise figures while aiming for a natural, analog-like presentation.
It sits between Delta–Sigma chips (efficient, mass-produced, technically excellent) and R-2R ladders (natural but resistor-limited), carving out a new “best of both worlds” approach in high-end DAC design.
Other features of the Topping D900 include selectable 10-band EQ and Bluetooth wireless capability through its LDAC circuit.
LDAC is a high-resolution wireless audio codec developed by Sony. It’s one of the options supported over Bluetooth to stream music from phones, computers, or other devices to headphones, DACs, or speakers.
, PRE, a volume of -30.0 dB, and PCM 44.1 kHz; A hand in the foreground is holding a smartphone that displays a menu from a companion mobile app for the Topping D900 DAC")
Key Features of LDAC
● High Bitrates: It can transmit audio at up to 990 kbps, much higher than standard Bluetooth SBC (around 328 kbps).
● Hi-Res Audio Support: Handles up to 24-bit / 96 kHz audio streams, making it suitable for lossless or near-lossless playback.
● Adaptive Modes: Automatically switches between 330 kbps, 660 kbps, or 990 kbps depending on Bluetooth signal quality and device capability.
How It Compares
● SBC: The default Bluetooth codec, widely compatible but lowest fidelity.
● AAC: Used in Apple devices, optimized for efficiency but limited in resolution.
● aptX / aptX HD / aptX Adaptive: Qualcomm codecs offering higher bitrates and lower latency.
● LDAC: Usually considered the best option when both source and destination devices support it, because it offers the highest bitrate and Hi-Res Audio certification.
Limitations
● Both your source device (phone, tablet, PC) and your receiver (DAC, headphones, speakers) must support LDAC.
● It can be less stable at the maximum bitrate (990 kbps) in noisy wireless environments, so devices sometimes fall back to 660 kbps or 330 kbps.
The front panel can display many different functions in various ways.

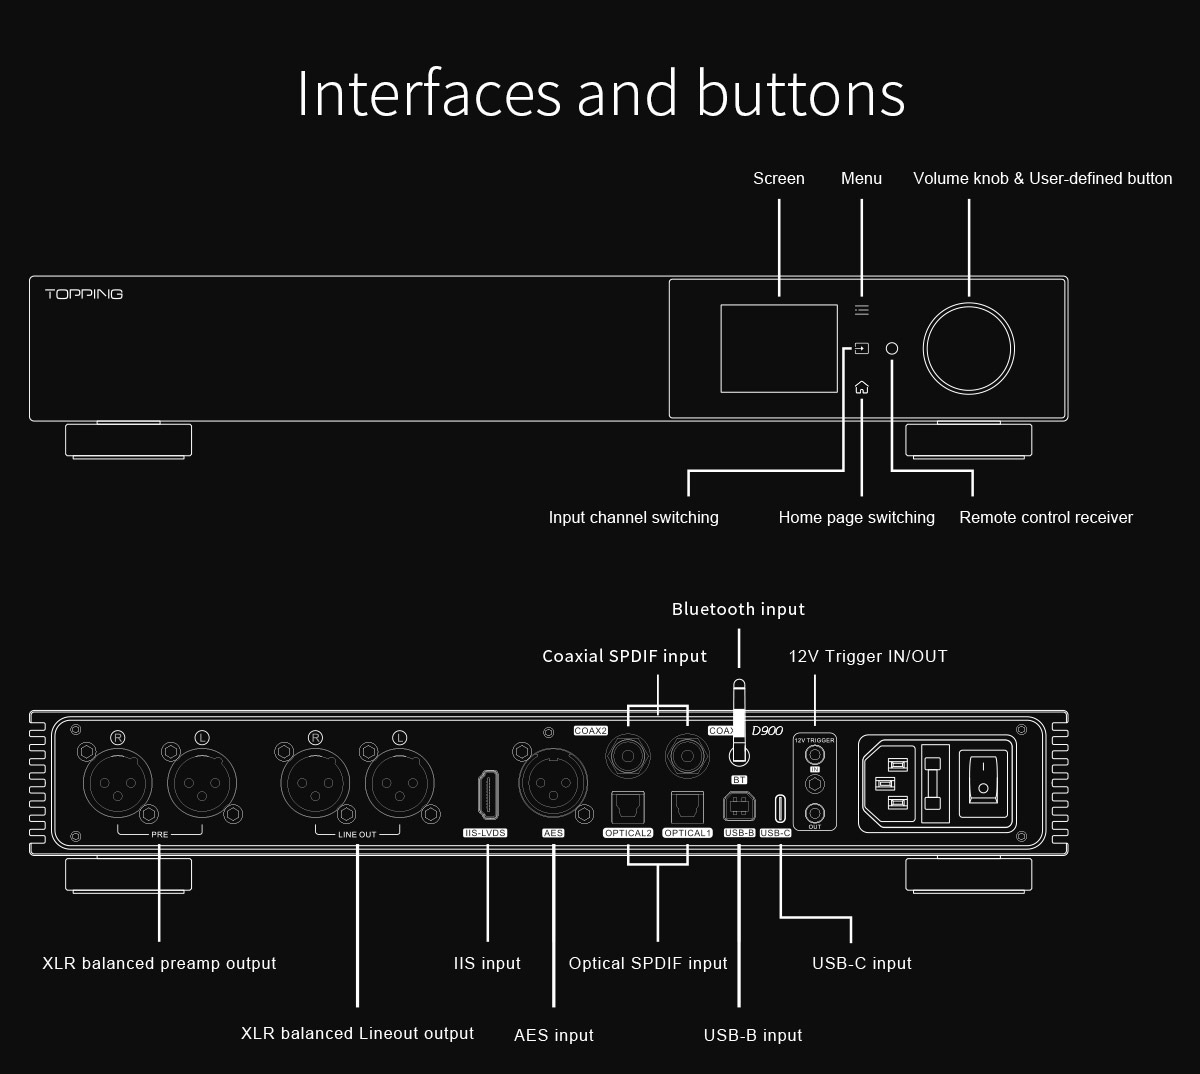
The rear panel, shown below, illustrates the full array of digital inputs and analog outputs, including an XLR/EBU, two optical, and two RCA Coax (SPDIF). For USB, both a USB-B and USB-C jack are available. You can tap the Preamp and Line-level analog outputs, selectable from the front panel volume control or remote.
, OPTICAL inputs (two), USB-B, USB-C, and BT (Bluetooth); A 12V TRIGGER port and the AC power inlet are on the far right")
The D900 comes with a very nice remote control, hewn from a single billet of aluminum.
; The copyrighted logo for Secrets of Home Theater and High Fidelity is in the bottom right corner of the photograph")
The main power toggle (linear grounded three-prong 120 V) on the rear (far right in photo below) has to be turned on before you can turn it on with the remote control or pressing the volume control knob on the front panel. If you use the main toggle, it resets everything, so leave it on and use the front volume knob or remote to turn it on. I suspect this may be something that can be corrected with a firmware update. I also noticed that if left in standby (toggle on rear turned on, front control turned off), the D900 turns on by itself once in a while if I have it connected to my laptop that is in sleep mode. Again, correctable with future firmware, I assume. The unit I have is from the first factory run. It is really new.
 is sitting on a glass-top wooden table showing its rear panel; The panel is connected with a power cord and a black antenna for Bluetooth; Various input and output ports are visible, including balanced XLR outputs for PRE and LINE OUT, and digital inputs; A small, silver colored Topping remote control for this DAC is resting on top of the unit")
The front panel displays the input, the preamp or line output setting, volume setting, and the digital format, DSD64 (2.82 MHz), in this case, when I ran the bench test to make sure it would decode DSD. There are some small heat sink fins on the side, although I think this is mainly decorative.
 is sitting on a glass and wooden table; The front display screen shows the input as USB, the mode as PRE, the volume as -2.0 dB, and the format as DSD 2.82 MHz; A small, silver Topping remote control for this DAC is resting on top of the unit")
Secrets Sponsor
I listened to the Topping D900 DAC using Qobuz streaming from my MacBook Pro M4 Max laptop, USB-C input on the D900, Preamp XLR balanced outputs (there are no RCA analog outputs) from the D900 (as opposed to the Line output) to my OPPO HA-1 Headphone Amplifier, and OPPO PM-1 Planar-Magnetic Headphones. I set the D900 volume control to -10 dB, which is 10 dB below full output. I then adjusted the volume control on the HA-1 accordingly. If you want more output voltage, use the XLR balanced Line output jacks, and select “All” on the front panel using the volume control knob. I used the Preamp output because full output at 0.01 dBFS was close to 4 Volts, which is a range that I prefer. As always, when first listening to a headphone setup, adjust the volume control on the headphone amplifier way down to start with, and then adjust upward to suit your needs.
Here are my standard albums:


Art Pepper, “Art Pepper Meets The Rhythm Section”
Art Pepper’s Art Pepper Meets The Rhythm Section continues to be my favorite classic jazz album of all time. I listen to it as much as I have watched Hitchcock’s Foreign Correspondent (1938), where I can recite every line before it is spoken. What I listen for here is Pepper’s particular reed sound from his alto saxophone. The reason is gross because it is spit in the mouthpiece that causes the reed to sound that way, and it was really gross through the D900.

Anne Akiko Meyers, “Mirror In Mirror”
Anne Akiko Meyers is an incredible violinist, and her 1741 “ex-Vieuxtemps” Guarneri del Gesù violin is just as amazing. She reaches the highest notes a violin can play, which stretches a DAC’s abilities (not to mention a speaker’s). There was not the slightest hint of harshness. Just clarity and smoothness beyond comprehension.

Aaron Copland, Louis Lane, Atlanta Symphony Orchestra, “Copland: Appalachian Spring Rodeo Fanfare for the Common Man”
This version of Copland’s Fanfare for the Common Man is my favorite. Unfortunately, it is a very old recording, so the analog tapes may not have been in very good condition by the time it was digitized. Nevertheless, it is terrific to listen to. The kettle drums thundered, and the trumpets blasted, and the D900 did nary a flinch.

Alessandro Piccinini, Mónica Pustilnik, “Lute Music”
I love lute music because it is so relaxing. This album of music by Alessandro Piccinini is a good example. It is not music to get up and dance to. It is music to sit down and snooze to. That is to say, as long as it is not edge-transient-enhanced, and it certainly was smooth with the D900.
Whoa! I just woke up again with this massive organ concert at Notre-Dame Cathedral in Paris (released September 4, 2025). Using hands and feet, at least 12 notes can be played at the same time. Congestion results if any component in the signal chain has significant amounts of distortion. Well, the D900 would have none of that (other than the thunderous reverberance from the vastness of the cathedral – they should have put the microphones closer to the pipes with sound-absorption panels behind the mics).
Overview & History
● The organ in Notre-Dame is one of France’s most famous and important organs. It’s often called the Grand Organ or Great Organ.
● The history is very old: organs have been in the cathedral since at least the 14th century. One early organ (documented in 1403) replaced earlier, more modest instruments.
● The current instrument’s lineage goes back to a major rebuild in 1730-33 by François Thierry. Since then, there have been many renovations and extensions. One of the most significant was by Aristide Cavaillé-Coll in the mid-19th century (completed around 1867).
Structure / Technical Specs
● The organ has about 8,000 pipes.
● It uses a console with five keyboards (manuals) and a large pedal board.
● Number of stops (which let the organist select different pipe-sets/timbres): about 109 stops in its latest configuration.
● The largest pipes are very tall: some are ~32 feet in height. The smallest pipes are tiny (some about the size of pencils) to achieve high pitches.
● It has expressive divisions (i.e., parts of the organ are enclosed so their volume/timbre can be modified) and a dual pneumatic registration system historically.
What Happened in 2019 Fire & the Restoration
● In April 2019, Notre-Dame suffered a devastating fire. Surprisingly, the Grand Organ survived mostly intact: it was not destroyed by flames. Damage was limited (one pipe had water damage among thousands).
● The biggest issues were lead dust (from the roof materials melted during the fire) that settled inside the organ, and thermal and water exposure.
● Restoration involved dismantling much of the organ. The pipes and parts were removed for cleaning, decontamination, and repair. Tuning and reassembly were planned carefully to match the cathedral’s acoustics.
● The reinstallation and tuning process took time; after restoration, the organ was formally re-blessed and made operational again. The cathedral reopened on December 7, 2024, and the organ was part of that reopening.

Vincent Dubois, “Eternal Notre-Dame”
Significance
● It’s not only large in physical size and number of pipes, but also in its artistic and cultural importance: the instrument has a major place in French organ music history, with many famous organists having held the post (e.g. Louis Vierne, Pierre Cochereau).
● It is designed to fill the vast space of the cathedral with sound— organ builders over centuries aimed to balance power, richness of timbre, and clarity.

Mozarteumorchester Salzburg, ORF Radio-Symphonieorchester Wien, Howard Griffiths, Pascal Deuber, Giorgi Gigashvili, Veriko Tchumburidze, Sofiko Tchumburidze, Sasha Calin, Marcus Thomas Pouget, “Mozart: Concertone KV 190, Horn Concerto No. 3, KV 447, Piano Concertos No. 2, KV 39 & No. 4, KV 41”
Mozart was very prolific. He composed all kinds of music, including these horn concertos, released September 4, 2025. Having played trombone in our high school marching band, I know the difference between the sound of a French Horn and a trombone. The characteristic overtones that distinguish the two instruments were perfectly clear with the D900 DAC. I used to sit in my room at my fraternity house in the 1960s and play “I’m Getting Sentimental Over You”, like Tommy Dorsey, or, rather, try to sound like him. Of course, I could not, but still, it was fun.

The Dave Brubeck Quartet, Time Outtakes
Dave Brubeck’s Time Out album is a classic. But did you know there is an Outtakes album, too? Here it is.
The Take Five track here is one that did not make it to the Time Out album. It was an “outtake”. The original was so famous that they finally released the one that almost went into the trash. The main part of the track is not as strong as the one on the original album. That is why it did not get published. But Joe Morello’s solo on this track is spectacular. Maybe they should have spliced in just this solo into the track that made the original album. It would have been simple with a digital recording studio’s capabilities. In any case, I could hear the sheen of Joe’s ride cymbal and the punchy sound of the snare as well as all of the toms (drums other than the snare).
I listen to Chopin Nocturnes to relax. Chopin also composed Mazurkas, re this version with Ingrid Fliter on piano, released September 4, 2025. They are supposed to make you want to get up and dance. I still prefer relaxing.
Both the Mazurkas and Nocturnes are short piano works by Chopin, but they serve very different artistic purposes and are rooted in different traditions.
Mazurkas
● Origin: Based on the Mazur, a lively Polish folk dance in triple meter. Chopin elevated this rustic dance form into sophisticated art music.
● Rhythm: Characterized by strong accents on the second or third beat of the measure, giving them a syncopated, sometimes off-balance feel.
● Character: Often playful, earthy, or nostalgic, evoking the sound of Polish village music. Chopin uses modal scales, drones, and folk-like ornaments to reinforce the national color.
● Mood: Ranges from joyful to melancholic, but always with a dance-like pulse underneath. They are less about virtuoso display and more about character and rhythm.
Nocturnes
● Origin: Inspired by the Irish composer John Field, who pioneered the genre. The word literally means “night piece.”
● Rhythm: Usually in free, lyrical cantabile style, with flowing left-hand arpeggios supporting a singing right-hand melody.
● Character: Introspective, poetic, and dreamlike. The focus is on lyricism and expressive ornamentation, not on rhythm or dance.
● Mood: Romantic and emotional, ranging from serene and tender to turbulent and passionate.
The Difference
● Mazurkas: rooted in folk dance rhythms, rhythmically distinctive, tied to Chopin’s Polish identity.
● Nocturnes: rooted in lyrical song, atmospheric, and often more universal in mood.

Frédéric Chopin and Ingrid Fliter, “Chopin: Mazurkas, Vol. 1”
If you imagine a salon in the 1830s:
● A Nocturne might feel like someone singing an intimate aria at night.
● A Mazurka feels like a personal memory of a rustic Polish dance, refined into art.
In any case, they are a delight to experience, and the effect is unlikely to be better than with the D900. Complexity displayed perfectly.
Secrets Sponsor
We get started (Figure 1 below) with 1 kHz, 44.1 kHz sampling, at 0.01 dBFS, which is close to full output (about 4 Volts). I used the Preamp output setting, which is the second set of XLR balanced output jacks on the rear. Output is 4.183 Volts. THD+N is 0.0003%. THD by itself (no noise factor) is 0.00007%. That is really low.

In Figure 2 below, I used a DSD64 test signal to make sure the D900 decodes DSD. It does. The 0.01 dBFS output is about 1⁄2 that of PCM signals, and distortion is down accordingly at 0.00003%. Notice also the noise shaping starting at about 22 kHz. If it were DSD128, the noise shaping would start at around 50 kHz.

I also tested high-res PCM, in this case 384 kHz sampling. Distortion (THD) was 0.00006%. THD+N is high because of the noise shaping.
For the Signal-to-Noise Ratio (SNR), looking at the spectrum . . .
● The fundamental test tone is at 1 kHz, -9.45 dBFS (≈ 12.43 dBV, 4.18 V RMS full-scale).
● The analyzer’s readout shows:
- N+D (Noise + Distortion, A-weighted): -91.9 dBV
- Noise floor: -51.9 dBV (broadband)
- SNR: 64.3 dB
That 64.3 dB SNR shown in the inset is not the DAC’s real SNR; it’s just what this particular FFT window and test level captured, and the noise shaping affects the calculation.
To estimate the DAC’s effective SNR from the plot:
● The noise floor is around -128 dBFS (at 10 Hz) or lower across the audible band with the selected FFT setting.
● With the tone at 0 dBFS (or close to it), the real SNR would be roughly:
0 dBFS → Minus 128 dBFS ≈ 128 dB SNR Non-A-weighted
This is slightly less than the published specs for the Topping D900, which lists SNR around 132–135 dB (A-weighted). However, note that the noise floor is affected by the FFT. From a practical standpoint, I obtained a maximum of 116 dB SNR. To obtain an actual 132 dB SNR would require special conditions including a Faraday cage surrounding the D900.

Here (Figure 4), I used 192 kHz sampling at a typical listening level of -6 dBFS (reasonably loud, but not extreme). THD is 0.000033%, well below -120 dBV.

Back to -0.01 dBFS, Figure 5 below. Note that the noise shaping is above 40 kHz. Once you get above 192 kHz sampling, the noise shaping is in the same region.

If we use a 22 kHz low-pass for the distortion measurement, THD+N goes down from 0.013% to 0.0064% (Figure 6). Notice also that the ENOB (Effective Number of Bits) is 15.7 when the noise shaping is part of the measurement (Figure 5). When it is not, the ENOB is 20.1 bits (Figure 6). Notice that the SNR is 84 dB with the noise shaping in the calculation (Figure 5) and 111 dB with the 22 kHz limitation, and the noise floor is starting to rise even then (Figure 6). So, you have to be very careful when stating numerical data.

At 10 kHz (Figure 7), THD goes up a bit (distortion usually increases at higher frequencies). And here, the 2nd-ordered harmonic is higher than the 3rd.

IMD was 0.00021% (Figure 8).

Expanding the X scale (Figure 9), you can see how few and how low the side bands are. Intermodulation distortion is very important because if it is high, the sound will be congested.

19 kHz and 20 kHz are a second type of IM test. Here (Figure 10), IM was 0.00022%, very low.

Expanding the X scale shows the side bands, which are small (Figure 11).

The 1/10th Decade test is shown below in Figure 12. The distortion and noise stay way down at -130 dBV and below. Superb!

The Frequency Response at 44.1 kHz, 96 Hz, 192 kHz, and 384 kHz is shown below (Figure 13). It is a Fast roll-off at 22.1 kHz but slower at the higher sampling rates. There is a general roll-off starting at 22 kHz for all the higher rates.

Distortion vs. Frequency (Figure 14). It’s very low throughout most of the audible band. The 2nd-ordered harmonic is the red line, the 3rd is the green line, and the 4th is the blue line. Distortion is also mostly below the noise floor (white line)

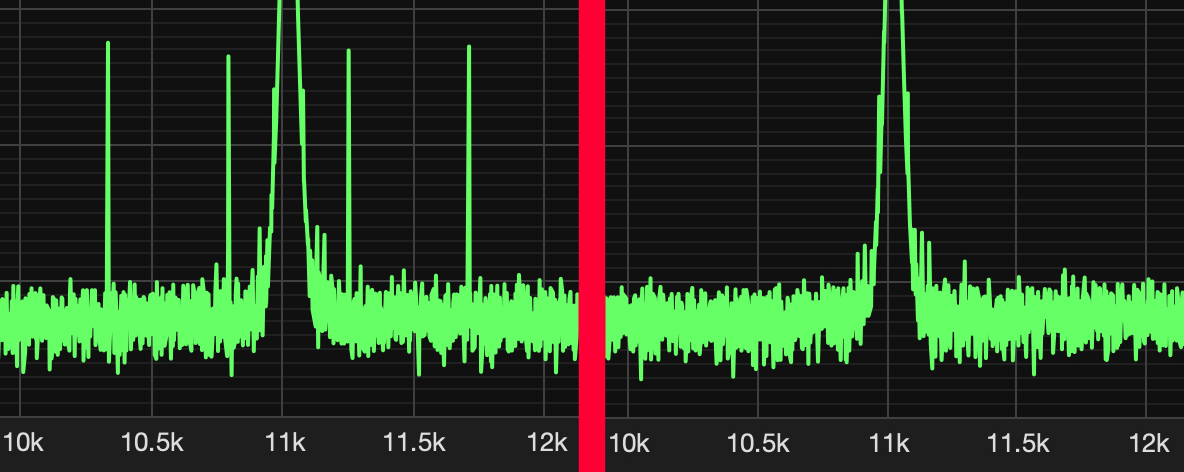
The J-Test is shown below (Figure 15). It uses an 11,025 Hz sine wave at -3.01 dBFS, which is “toggled” (explained below) at low level 229 Hz. This stresses the DAC in such a way that it can produce jitter. The base of the 11,025 Hz peak (purple arrow) should not have an increased number of sidebands compared to the same 11,025 Hz peak in a non-J-Test sine wave spectrum (Figure 16). Large side peaks are always produced about 500 Hz apart, as shown here (red arrow) between 7 kHz and 15 kHz, but the test uses a diagonal line drawn from the tip of the peak near 7 kHz to the tip of the peak near 15 kHz (there are additional peaks lower than 7 kHz and higher than 15 kHz).
We want to see if peaks go above the diagonal line (as per JA at Stereophile), which would indicate that the DAC under test is subject to jitter. In this case, all peaks are below the diagonal line, so the Topping D900 DAC passed the test.
What we have found is that all modern DACs pass this test, but it is important to test each one. Just as significantly, the lack of additional “spurs” in between the peaks spaced 500 Hz apart indicates that the D900 is particularly clean, showing that the power supply is free of noise.
Further Notes:
1. The main carrier
● The tall spike at 11.025 kHz is the intended J-Test sine wave.
● This is the reference tone — ideally, it should stand tall and clean.
2. Jitter-induced sidebands
● What we look for first are symmetrical sidebands close to the main tone (very near, and on either side of 11.025 kHz).
● Jitter modulates the carrier, producing pairs of spurious tones offset by small amounts (tens to hundreds of Hz).
● In a DAC with poor clocking or poor jitter rejection, you’d see “skirts” or sidebands hugging the main tone.
3. Data-related artifacts (the peaks about 500 Hz apart)
● The peaks every ~500 Hz across 7–15 kHz are not jitter sidebands — they’re caused by the toggling LSB pattern built into the J-Test signal.
● Those “teeth” are normal and will show up in every J-Test. They prove the DAC is resolving the low-level bit pattern correctly.
● They’re not a fault; they’re expected by design.
4. What a good J-Test result looks like
● Clean central tone at 11.025 kHz.
● The comb of evenly spaced lines ~500 Hz apart, visible but at very low levels (–120 dB or lower).
● No extra sidebands hugging the main tone, and no raised noise floor around it.
5. Interpreting the graph
- The 11.025 kHz carrier is clean.
- The expected ~500 Hz data-related pattern.
- No additional jitter sidebands or elevated noise floor.
An Explanation of What the J-Test Is
The J-Test was designed mainly to see if there are many small sidebands very close to the base (purple arrow) of the 11.025 kHz sine wave (those would indicate jitter). The ~500 Hz evenly spaced peaks between 7 kHz and 15 kHz (red arrow) are normal parts of the J-Test pattern, not jitter. So, the results should show very few sideband peaks close to the base of the 11.025 kHz sine wave, and the evenly spaced ~500 Hz peaks below the diagonal line. That is what we see in the D900 J-Test spectrum below.

Here is an 11,025 Hz sine wave at minus 3.01 dBFS by itself (Figure 16). No 229 Hz toggling. You can compare the small number of side peaks at the base of the sine wave with the number of side peaks at the base of the sine wave in the J-Test spectrum shown in Figure 15. They are the same. So, the J-Test stress did not induce any jitter.

A closeup of the base of the 11.025 kHz sine waves in Figures 15 and 16 is shown below.
The J-Test tones at 229 Hz and 11,205 Hz are not arbitrary — they’re chosen very deliberately to stress the clocking and data handling of digital audio systems.
1. Relationship to the Sampling Rate
- 229 Hz corresponds to 44,100 Hz ÷ 192.
- 11,205 Hz corresponds to 44,100 Hz ÷ 3.9375 (exactly 44,100 / 3.9375 = 11,205).
2. Why Two Frequencies?
● 11,205 Hz (≈ quarter of Nyquist): High-frequency test tones are more sensitive to jitter. A tiny timing error at the sample clock produces a proportionally bigger phase error at high frequency. This makes 11.205 kHz a very revealing tone for uncovering jitter-induced sidebands.
● 229 Hz (low tone): Provides a “clean baseline” where jitter has much less audible effect. If distortion sidebands appear around 229 Hz, they’re very easy to see separated from the fundamental.
3. Alternating Pattern for the J-Test
● The classic J-Test (from Julian Dunn / Audio Precision, late 1980s–1990s) uses a special data pattern: the high-frequency 11.205 kHz tone is modulated with toggling LSBs (Least Significant Bits). This produces spectral components that make jitter sidebands especially obvious.
● The 229 Hz variant is often used in lower-rate versions or as a control reference.
4. Practical Outcome
- Exact synchronization with 44.1 kHz sampling.
- Predictable FFT bins for analysis.
- Maximum visibility of jitter artifacts (sidebands symmetrical around the fundamental).
- Comparability across different analyzers and reports.
In short:
● 229 Hz = a low-frequency reference tone aligned to the sample clock.
● 11,205 Hz = a high-frequency tone near Nyquist, maximally sensitive to jitter. Both are chosen because they’re mathematically “clean” within the 44.1 kHz grid, making them ideal probes for jitter analysis.
Review: There are two ingredients in the J-Test.
- The main audio tone
- A sine wave at 11.025 kHz (1⁄4 of 44.1 kHz).
- Not a square wave — the fundamental test signal itself is a clean sine.
- The LSB toggling pattern
- The least significant bit (LSB) is forced to flip back and forth between 0 and 1 at 229 Hz.
- That flipping is therefore a square wave in the digital data stream, but it’s not an audible 229 Hz tone in the analog output by itself.
- Instead, it rides “inside” the bitstream and modulates the high-frequency tone.
What that means in practice
● The 229 Hz toggling acts like a square-wave modulation of the low-order bits.
● The 11.025 kHz sine remains the “carrier.”
● In the spectrum, the toggling doesn’t just create a 229 Hz tone; it creates sidebands around the 11.025 kHz fundamental at 11.025 kHz ± 229 Hz, ±458 Hz, etc.
● That’s why you see a “comb” of symmetrical spurs in the FFT when jitter is present.
● The classic J-Test toggling rate is fs/192 ≈ 229.6875 Hz at 44.1 kHz. (Some generators round to 229 Hz—that’s fine, just note it.)
● “Toggling” means the LSB follows a square wave at that rate: it goes 0→1→0 once every ~1/229 s. (If you’re counting edges, there are 2 × 229 bit flips per second.)
● SUMMARY The J-Test (16/44.1): a 11,025 Hz sine with the LSB forcibly set to a square wave at ~229.7 Hz (fs/192), producing sidebands at 11.025 kHz ± 229.7 Hz, ± 2×229.7 Hz, etc.

1. Each PCM sample is a binary word
At 16-bit / 44.1 kHz, every sample is a 16-bit integer like:
0000 0110 1011 0101
The least significant bit (LSB) is the far-right “1.” It normally changes in a random way, depending on the exact amplitude of the sine wave at that moment.
2. What “square wave at 229 Hz” means
● A square wave is just a signal that alternates between two states (0 and 1) at a regular frequency.
● In the J-Test file, the LSB is forced to follow such a pattern:
- For ~1/229 s, the LSB is always 0.
- For the next ~1/229 s, the LSB is always 1.
- Then back to 0, then 1, and so on.
Example (simplified binary words):
… 1010 0110 -> last bit forced to 0
… 1010 0111 -> last bit forced to 1
… 1010 0110 -> forced back to 0
… 1010 0111 -> forced back to 1
3. Why it matters
● That repeating 0→1→0 sequence at 229 Hz is perfectly predictable.
● It doesn’t contribute much audible energy (it’s only 1 LSB), but it modulates the 11.025 kHz sine wave.
● On an FFT, you see:
- The main 11.025 kHz tone, plus
- Sidebands spaced at ±229 Hz, ±458 Hz, etc., plus
- A tiny spur at 229 Hz itself (the fundamental of that LSB square wave).
So, “the LSB is set to a square wave at 229 Hz” means the lowest bit in each 16-bit sample is overwritten such that, instead of reflecting the sine’s natural quantization, it is forced into a regular 0/1 square-wave pattern at 229 Hz. That’s what creates the unique J-Test spectrum.
How the 229 Hz toggling is generated:
It’s not something the analog sine “naturally does.” It’s deliberately engineered into the digital test file:
-
- Basetone:
Start with a clean sine wave at 11,025 Hz, sampled at 44.1 kHz.
- This is exactly 1⁄4 of the sampling rate, so it lines up perfectly with the digital clock.
-
- Manipulate the data stream:
- That means, even while the main 11 kHz sine samples are being encoded normally, the LSB is overwritten:
● For ~1/229 of a second, the LSB is fixed at 0.
● For the next ~1/229 of a second, the LSB is fixed at 1.
● Then back to 0, and so on.
- Resulting digital waveform:
- To the DAC, the file looks like: “11,025 Hz sine tone + tiny ±1 LSB steps occurring in a 229 Hz square-wave rhythm.”
- Those tiny steps are only ~0.00003 of full scale in 16-bit audio, but they’re very effective at stressing the data/clock recovery.
Why 229 Hz specifically?
● 229 Hz = 44,100 ÷ 192.
● This makes the toggle period exactly an integer number of samples, so the pattern is sample-synchronous and repeats perfectly.
● That guarantees:
- No spectral leakage in FFTs.
- A clean, stable spur structure (sidebands at ±229, ±458, … around 11.025 kHz).
Untoggled (normal fs/4 sine, 16/44.1)
● Sampling rate = 44,100 samples/sec.
● That’s a square wave at 22.05 kHz.
● One full cycle of that square wave = 2 flips (0→1, then 1→0).
● So: 22,050 cycles/sec × 2 flips = 44,100 flips/sec.
J-Test toggled
● The natural fast 22.05 kHz LSB pattern is masked off.
● The LSB is overwritten to follow a much slower square wave at fs/192 = 229.7 Hz.
● One full cycle = 2 flips again.
● So: 229.7 cycles/sec × 2 flips = ~459 flips/sec.
The J-Test replaces the LSB’s natural 44,100 flips per second (a fast 22 kHz square wave) with only about 459 flips per second (a slow 229 Hz square wave).
So, the toggling is not “caused” by the sine itself. It’s inserted by design into the LSB of the test signal file. That’s what makes the J-Test unique: it forces a DAC or digital interface to process a predictable, repeating bit pattern that strongly interacts with jitter mechanisms.
 shows five binary code lines and their corresponding Least Significant Bit (LSB) values, resulting in an irregular LSB pattern of 0, 1, 0, 1...The bottom section, labeled After J-Test LSB toggling shows five modified binary code lines with their LSB forced to create a regular LSB pattern of 0, 1, 0, 1, 0... (clean square wave)")
Julian Dunn’s story is an interesting one in digital audio history.
● He was originally with Prism Sound in the UK during the late 1980s and early 1990s.
● At Prism, he worked on AES/EBU digital interface design, jitter measurement methods, and test signals — this is where he introduced the J-Test and wrote several AES papers on jitter audibility and measurement.
● His work became so influential that Audio Precision licensed/adopted his methods into their analyzers. That’s why you often see the J-Test associated with AP instruments, even though it was conceived at Prism Sound.
State-of-the-art DACs like the Topping D900 are already near the measurement limits of test equipment: Distortion below –120 dB, noise floors beyond audibility, and jitter artifacts essentially absent. So, what could future designs bring? There are still a few frontiers left:
1. Beyond Measurement Transparency
● Dynamic range: We’re already at ~130 dB A-weighted in consumer DACs. Human hearing tops out at ~120 dB in ideal conditions. Gains here are academic — but may help in ultra-low-level mastering or scientific work.
● Distortion floor: Modern DACs push THD+N below –125 dB. The next step is eliminating the last trace of non-linearity, even under difficult loads.
● Jitter immunity: Already excellent with async USB and internal re-clocking, but future designs may fully decouple the DAC from any input timing.
2. Filtering and Time Domain Improvements
- Sharp vs. slow roll-off, apodizing filters, minimum-phase, NOS (no oversampling).
- Even if FR/THD look identical, time-domain ringing and phase behavior can change the subjective presentation.
3. Integration with Analog and Amplification
- Output op-amps, I/V converters, and power supplies affect distortion, noise, and subjective tone.
- Expect more use of discrete stages, GaN transistors, and ultra-low-noise regulators.
4. Formats and Processing
● Higher-rate DSD/PCM support (DXD, DSD1024) — not for human hearing, but for better DSP headroom.
● Integrated DSP (room correction, crossfeed, headphone EQ) inside the DAC, while keeping transparency intact.
● Adaptive digital filtering that changes behavior based on input sample rate and content.
5. Practical / User-Oriented Gains
● Power efficiency: Lower heat and energy draw without sacrificing transparency.
● Miniaturization: Getting desktop-DAC performance into portable dongles.
● Networking & interfaces: Better integration with streamers, wireless (low-jitter Wi-Fi DACs), or direct Ethernet inputs.
● Price/performance: Flagship transparency at commodity pricing (already happening).
6. Where Research Might Go
● Psychoacoustic optimization: Instead of just lowering numbers, DACs could be tuned around how our hearing perceives time, masking, and microdynamics.
● Error correction for sources: Smarter reclocking, or even compensating for imperfections in digital streams.
● Hybrid DACs: Combining R-2R linearity with ΔΣ noise-shaping precision in one architecture.
Bottom line
Future DAC design gains won’t be about “can you hear the distortion” — that war is over. Instead, it will be about:
● pushing time-domain fidelity further,
● refining digital filtering and reconstruction,
● improving integration with analog stages,
● and making ultimate transparency cheaper and smaller.
That’s why reviewers increasingly say: “All good DACs sound the same.” But engineers will keep chasing vanishingly small improvements in how digital audio is reconstructed.
The Topping D900 leaves little doubt that it belongs in the upper echelon of modern digital-to-analog converters, especially considering its price.
- Solid build
- Very low distortion
- Very low noise
- High performance to cost ratio
- USB-A input jack to play local files stored on a thumb drive or SSD
The measured distortion is vanishingly low, and the noise floor almost disappears into the limits of test equipment, creating a foundation of technical transparency that few products can equal. In practice, these numbers translate into sound that is free of haze, grit, or unwanted coloration. Instead, what emerges is a presentation of exceptional clarity, where the smallest nuances in recordings are revealed with ease. Micro-dynamics, reverberation trails, and spatial cues that lesser converters tend to blur are rendered with precision.
Such performance underscores how critical the DAC is in the signal chain. Regardless of how refined the amplification or loudspeakers may be, a compromised converter upstream will veil information and restrict dynamics. The D900 demonstrates the opposite effect: by keeping distortion and noise below audibility, it allows every subsequent stage to work at its best. Listeners may find familiar recordings yielding new levels of intimacy and realism, not because of any editorial “voicing,” but because the DAC is stepping out of the way and letting the source material speak for itself.
For those who still question whether digital playback has reached maturity, the D900 offers a persuasive answer. Topping has combined superb engineering discipline with innovative decoding technology, and the result is a converter that competes with units costing several times as much. The D900’s fine detail retrieval is spectacular, its noise performance exemplary, and its overall contribution to system fidelity impossible to overstate. As the essential bridge between digital media and the analog world, we hear, the DAC deserves as much attention as any amplifier or transducer. With the D900, Topping has proven that this attention can pay extraordinary dividends.