Co-Author: Carlo Lo Raso
Among these components could be CD players, Blu-ray players, USB DAC boxes, AVRs, stereo preamplifiers, and multichannel preamplifier-processors.
We focus on understanding how the signal-to-noise ratio relates to the noise floor of the FFT spectrum found in the reviews. We emphasize that the FFT noise floor is NOT the component’s noise—a widespread mistake.
Preliminary discussion
The technical article “An Audiophile’s Guide to Quantization Error, Dithering and Noise-Shaping in Digital Audio” by John Johnson is a prerequisite for this article.
The quantization process, as explained in the paper above, converts an analog signal into a discrete set of steps by the Analog-to-Digital Converter (ADC). The quantization process is discussed in detail in the above article.
The number of steps is determined by the converter’s bit depth (N).
Quantization steps = 2N
If N is 16, then the converter has 65536 steps: the more steps, the more accurate the representation of the signal. Due to the finite number of steps, an Analog-to-Digital converter will add noise and distortion to the signal.
The Digital-to-Analog (DAC) converter converts the quantized, sampled digital data from the Analog-to-Digital converter (ADC) back into analog.
The sampled data for the DAC is contained in a .wav file. The .wav format is the direct Linear Pulse Code Modulated (LPCM) amplitude values at each sample point in time.
https://en.wikipedia.org/wiki/WAV
To record WAV files to an Audio CD, the file headers must be stripped and the remaining PCM data written directly to the disc. You can download music as a .wav file directly or a reduced-sized file, such as FLAC, which is converted back to .wav.
For this article, we assume the Analog-to-Digital converter that created the .wav file is ideal, and we will focus on performance degradation at the DAC side. .wav files can be generated, edited, and manipulated with relative ease using software. This allows us to create sine-wave test signals at different sample rates and bit depths, and to dither them with a single touch on the computer screen. We used REW to generate the signals, but many other programs can do this as well.
The Signal to Noise Ratio (SNR) is a comparison of the encoded signal level to the noise of an electronic component. The Dynamic Range is the ratio of the maximum signal level the electronic component can produce without clipping to the noise level. For most products, the maximum levels are 2VRMS for RCA and 4VRMS for XLR.
For a data converter, the Dynamic Range depends on the bit depth N. The Dynamic Range is the SNR when the signal is large enough to use all the levels (full scale). Dynamic Range is often called Full-Scale SNR.
Unless otherwise noted, SNR is assumed to be full scale in this article. Those who want more detail on how Full-Scale SNR is calculated can read the formulas below.
SNR (dB) Full Scale = (6.02N + 1.78)dB
N is bit depth, so for a 16-bit DAC, we find:
SNR = 98.1dB = (6.02(16) + 1.78)dB
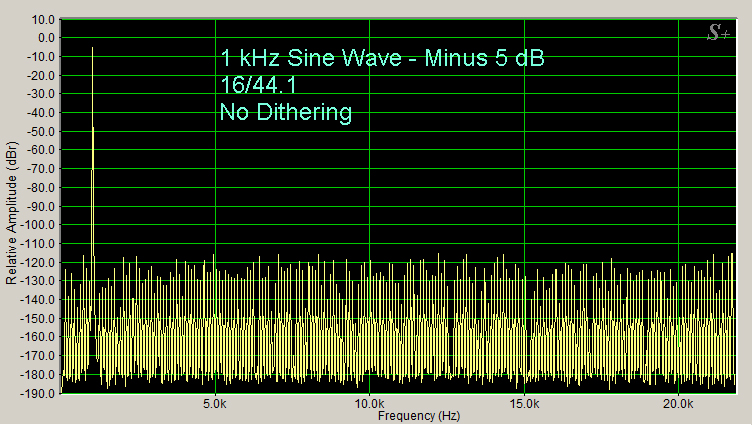 Figure 1 Spectrum is of a 1kHz signal quantized to 16 bits
Figure 1 is from An Audiophile’s Guide to Quantization Error, Dithering and Noise-Shaping in Digital Audio.
The above spectrum is of a 1kHz signal quantized to 16 bits. The sampling rate is 44.1k samples/sec. The x-axis stops at 22kHz, which is the full bandwidth that can be encoded at this sample rate.
As the article by Dr. Johnson explains, if no dither is applied, then significant distortion appears across the band when the signal is quantized into levels. This is shown in Figure 1.
This is a computer simulation. The digital 1kHz .wav file is computed directly without an ADC, and the digital data is sent directly to the spectral display. This allows us to see the effect of sampling without the noise or distortion introduced by the ADC and DAC electronics.
All the remaining spectra in this article use a direct .wav dithered sine-wave source. Adding dither converts the distortion associated with quantization into noise. To understand that statement, you need to go back to the John Johnson article.
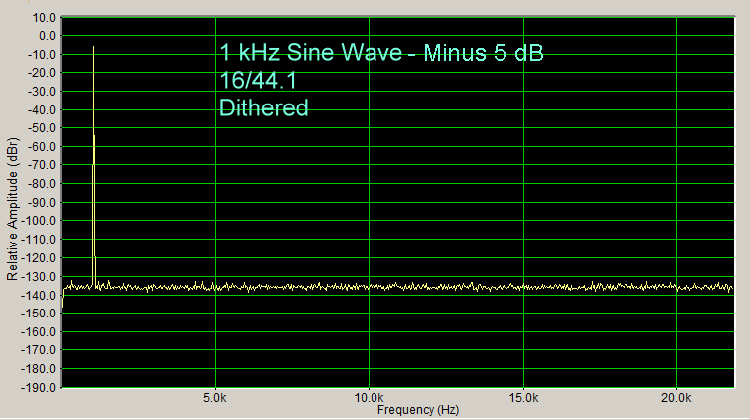 Figure 2 Spectrum is of a 1kHz signal quantized to 16 bits with dither
Figure 2, also from the article cited above, shows that when dither is added to the 16-bit quantized data stream, the distortion is removed and replaced by noise. This is also a computer simulation with no analog electronics. As in Figure 1, the SpectraPlus software was used to produce the spectrum.
Many different types of dither exist. The dither most common in audio has a triangular probability density function (TPDF). This dither introduces the minimum extra noise required to eliminate the distortion and produce a constant noise floor (no noise modulation).
Applying dither reduces the SNR. This is the penalty for converting the distortion to a constant noise floor. For TPDF dither, the SNR is reduced by 4.77dB. The reference below gives the mathematical details:
https://en.wikipedia.org/wiki/Dither
For audiophiles, I again recommend the article by Dr. Johnson instead:
With the dither accounted for, the Full-Scale SNR (dynamic range) for a 16-bit DAC is calculated as 93.33dB:
SNR (dither) = SNR (no dither) – 4.77dB = 98.1dB – 4.77dB = 93.33dB
Understanding Processing Gain and the FFT Noise Floor
The remaining set of figures will follow the development presented in the tutorial published by the data converter supplier Analog Devices:
“Understand SINAD, ENOB, SNR, THD, THD + N, and SFDR so You Don’t Get Lost in the Noise Floor” by Walt Kester.
You do not need to read the reference, unless you are so inclined, as it is written for engineers. It is an excellent reference if you have the necessary background.
We start by looking at the spectra of a tone -90dB from the Full-Scale signal. Full-Scale is abbreviated as FS. Full-Scale is typically 4VRMS at the XLR output. A signal -90dB down from Full-Scale would be 126uVRMS.
We can normalize Full-Scale from 4VRMS to 1VRMS. The value of 1 is 0dB. The Full-Scale level, normalized, is thus 0dBFS. You will know when Relative Amplitude is being used because the Y-axis on a graph is labelled dBr. In Secrets, it is rare to see dBr, though it can be very helpful for seeing distortion values and noise, since they all refer to 0dB, not the absolute Full-Scale level.
The 1kHz tone in this graph is down by -90dB (-90 dBFS). The -90 dB tone is selected so no distortion should be visible in the spectra from real DACs. This allows us to focus solely on the noise. If we see distortion at this level, the DAC has issues discussed in an article on DAC box performance on this website.
https://hometheaterhifi.com/30th-anniversary/looking-back/introduction-to-dac-boxes/
If the tone was smaller, these DAC distortion issues may not be seen. Using no tone (digital silence, often called all 0s) may turn off a DAC, and the noise will drop significantly. Think of it as a cheat by the DAC manufacturer. When the DAC sees digital silence, it knows it is being tested and tries to look better than it is.
The following four figures are again a computer simulation with no electronics. The .wav file is sent directly to the spectrum analysis software, as was the case for figures 1 and 2. No harmonic distortion associated with analog electronics occurs in the computer simulation, provided dither is included in the .wav file. The difference between figures 1-2 and figures 3-6 is that the SpectraPlus tool was used to produce the first two figures, whereas the REW tool was used to create the spectra for the following four figures.
The spectrum is created by a Fast Fourier Transform (FFT). Technical details of the FFT needed to fully understand the concepts presented here are briefly explained at the end of this article.
Also see Dr. Johnson’s article in Secrets on Fast Fourier Transforms:
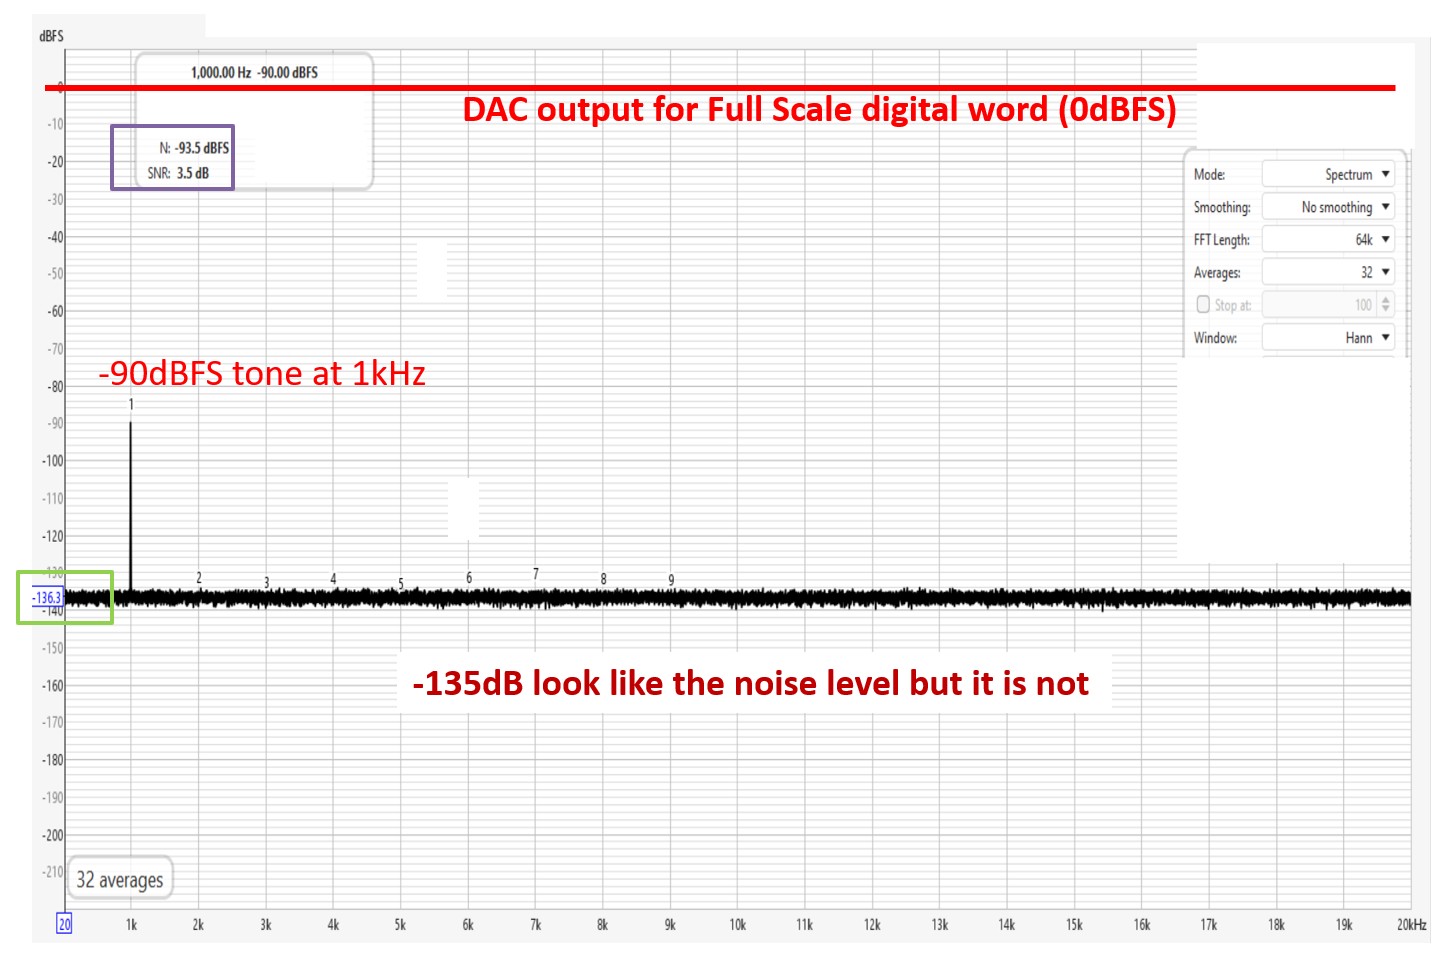 Figure 3 Spectrum is of a 1kHz signal quantized to 16 bits with dither shown by REW
The -90dBFS tone is being used in this simulation for the reasons outlined above.
Looking at the spectra in Figure 3, you see the noise floor is at -135dB. You might conclude that this is the DAC’s noise level. The signal-to-noise ratio of the DAC would be 135dB relative to the full-scale signal if this were the FFT showing the actual noise level, but that is not correct. The correct SNR ratio for a 16-bit DAC with dither is 93.31dB, as we discussed above.
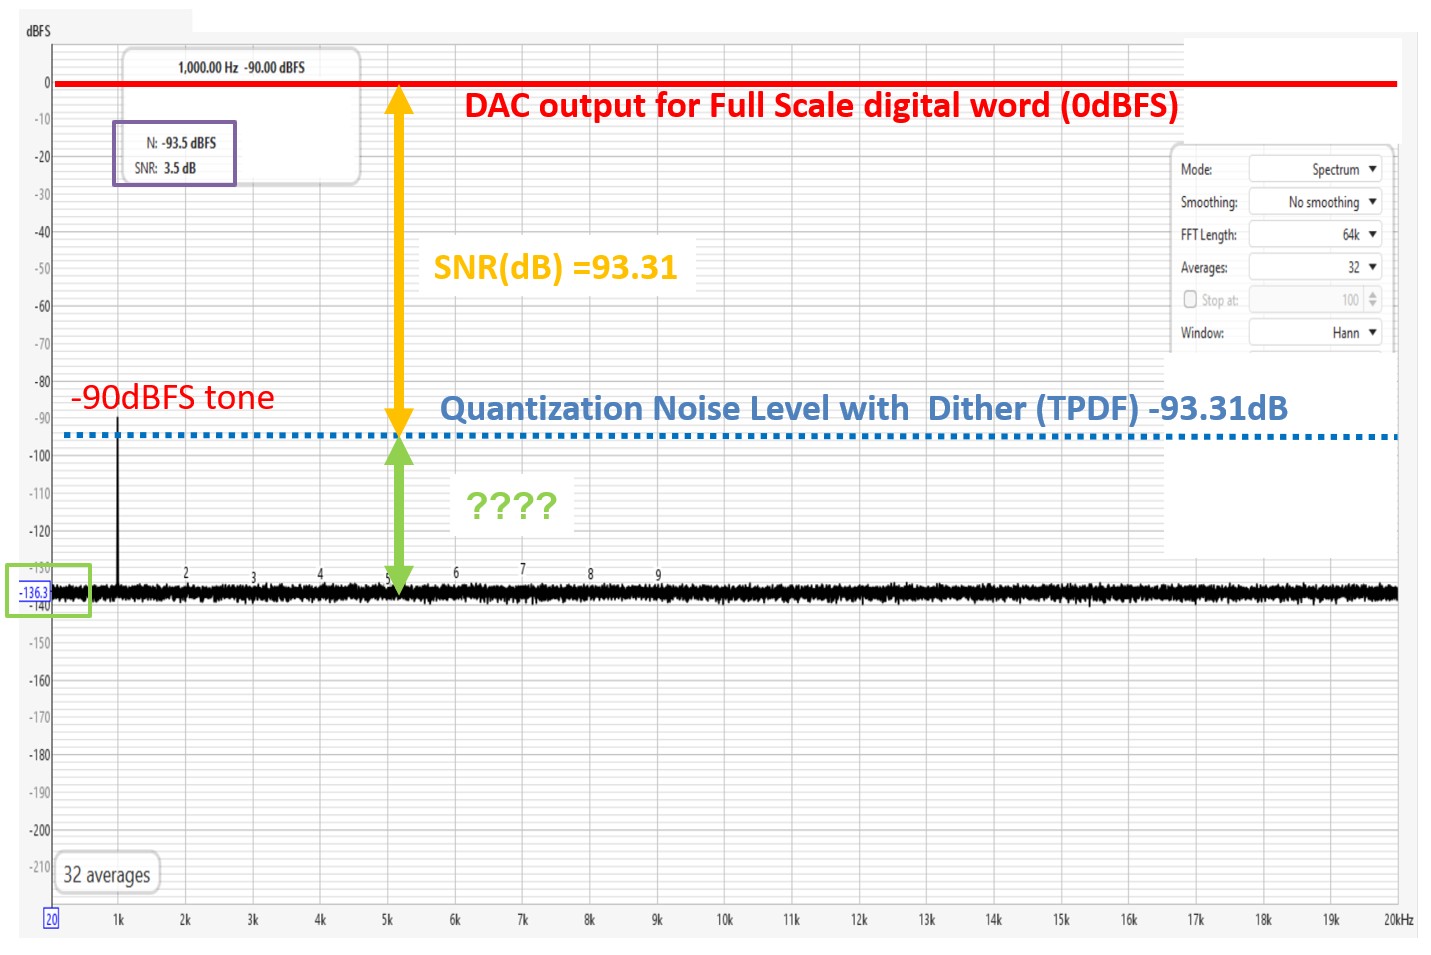 Figure 4 Difference between the true noise floor and the FFT noise floor
In Figure 4 above, I have inserted a yellow arrow showing the Full-Scale SNR (dynamic range) of the 16-bit DAC with dither, which is 93.31dB (yellow arrow). The arrow starts at the 0dBFS Full-Scale signal. The dotted blue line is the noise level defined by the end of the yellow arrow. I have marked the difference between the DAC converter’s noise and the spectra noise floor with a green arrow. What is the value of the green line, and what caused the reduction in the FFT spectra noise floor?
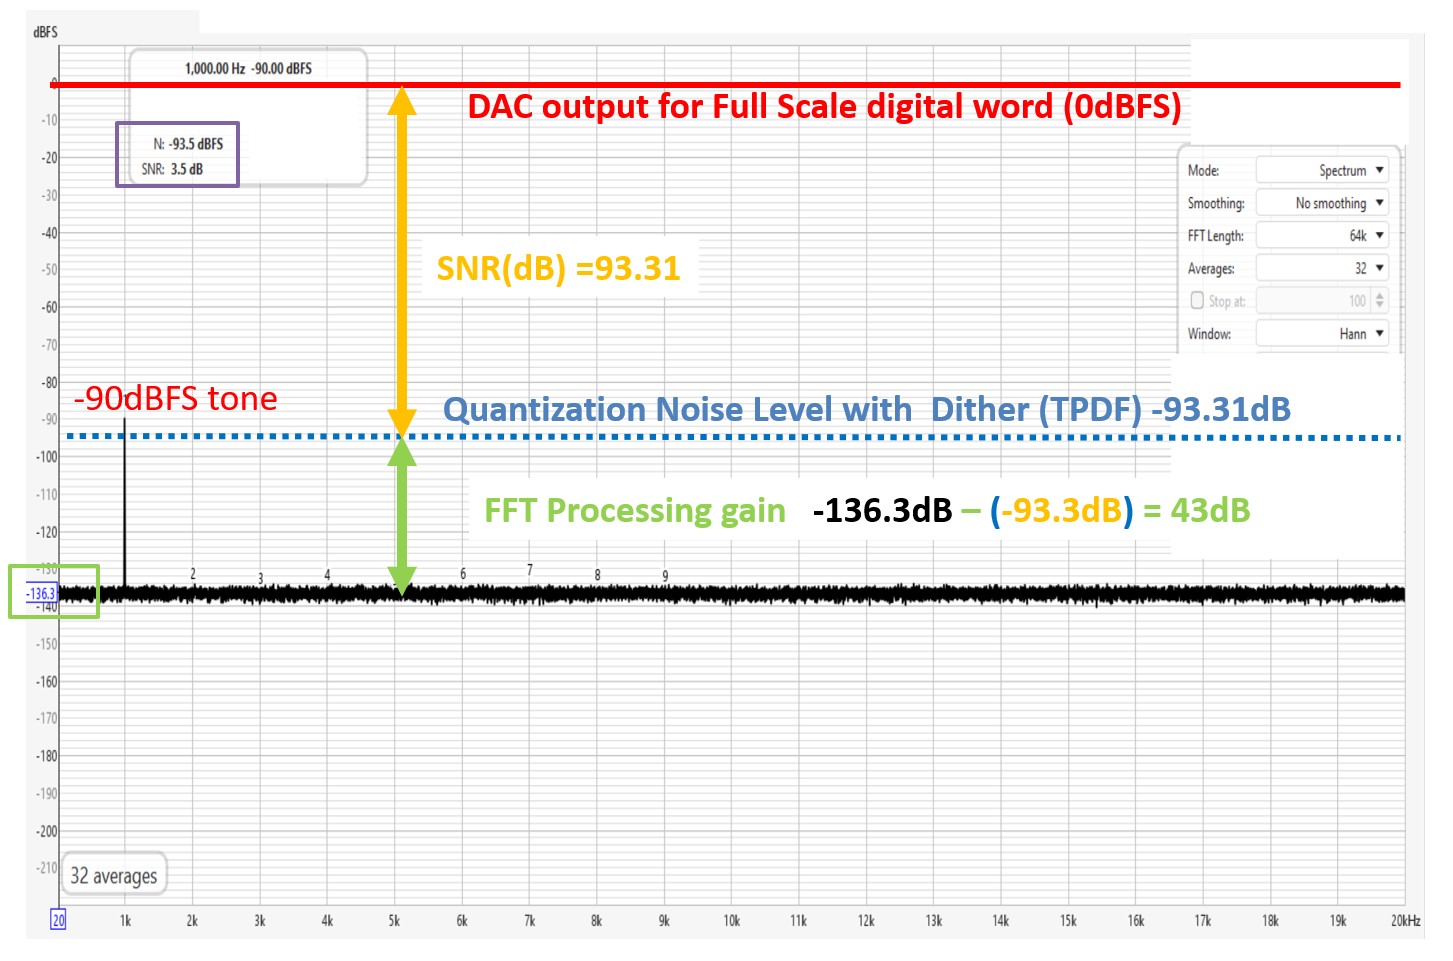 Figure 5 Processing again between the true noise floor and the FFT noise floor
In Figure 5 above, you can see that the difference between the true noise floor and the FFT noise floor is 43dB. When converted from decibels, the FFT noise floor is 0.008 dB lower than the actual level. That is a very large error.
What has caused the 43dB difference? The FFT does not display the noise floor over the full bandwidth of the incoming signal (22kHz when sampling at 44.1k samples/sec).
The Full-Scale SNR is over the entire 0Hz to 22kHz bandwidth. The FFT divides the 22kHz noise spectra into small bins. Each bin is a few Hz wide. Noise falls into one of these small bins, and this is what is displayed. Since only a tiny fraction of the noise is in each bin, the overall FFT noise floor drops.
The difference between the FFT noise floor line and the SNR is called the FFT processing gain. The processing gain in the above spectra is 43dB. For those who want to know why the value is 43dB in this example, it requires some calculations, which I have provided below in blue. You can skip this section, unless you are really into following the math.
The FFT size for this example is 65536 (216). This is the number of computations the FFT must perform.
If we collect 65536 samples (M) for the FFT, then the noise spectrum is divided into 32768 slices (M/2).
M/2 = 65536 samples / 2 = 32768 FFT bins
The line that represents the FFT noise floor moves down from the true noise level by the number of FFT bins. This is called the Processing Gain.
The Processing Gain is 10log(M/2).
We use 10, not 20, in this decibel calculation since noise is expressed in units of power, not voltage.
10log(M/2) = 10log (65536/2) = 45dB.
This value may change depending on the window used for the FFT. Windows are out of the scope of this article. The Audio Precision measurement system uses a different window than the REW and SpectraPlus tools, so you will see significant differences in processing gain between the two systems.
For the window used in REW, the Processing Gain is reduced by 2dB to 43dB. SpectraPlus, which Secrets uses in many reviews, has a processing gain of about 43.7dB.
SpectraPlus was used for the first figures 1 and 2 of this article and will be used for figures 7 – 10 below.
The noise floor for a 16-bit dithered signal using the SpectraPlus software in Figure 2 of this article is about -137dB, yielding a processing gain of approximately 43.7dB. We will show how this number was calculated in Figure 7 below.
The bin size depends on the relationship between the FFT length and the input signal’s sampling rate. For the 65536 FFT, we have 32764 bins, and the bin width is 0.7Hz wide over the 22kHz bandwidth for a signal sampled at 44.1kHz.
Changing the FFT size changes the processing gain. Doubling the FFT size increases the processing gain by 3dB. A large processing gain allows us to detect small-amplitude signals or low levels of distortion, since the reduced level reveals signals otherwise buried by the FFT noise floor.
As you would expect, a larger FFT requires more computational power. Yet with today’s PCs, this is not much of an issue unless you use very large FFTs. At Secrets, most spectra use an FFT size of 65536.
Secrets Sponsor
Let’s look at another example. This time, we will increase the DAC bit depth to 24 bits. Using the SNR calculation above, for a signal with 24-bit quantization and dither, we get an SNR of 141.5dB. I show the calculation in blue for reference; you can skip it if you wish.
SNR (no dither) = 146.28dB = (6.02*(24) + 1.8)dB
SNR (dither) = SNR (no dither) – 4.77dB = 146.28dB – 4.77dB = 141.5dB
The 24-bit word has reduced the noise to -141.5dB compared to a 16-bit word, -93.31dB
The difference is 48.17d
The next plot is again a computer simulation. The spectra below show how the FFT noise floor changes when using an ideal 24-bit data stream. The tone is again at 1kHz and is -90 dB down from full scale (0 dBFS).
Again, the Y axis indicates this is a relative plot. The Full-Scale voltage has been scaled to 1 VRMS (0 dB).
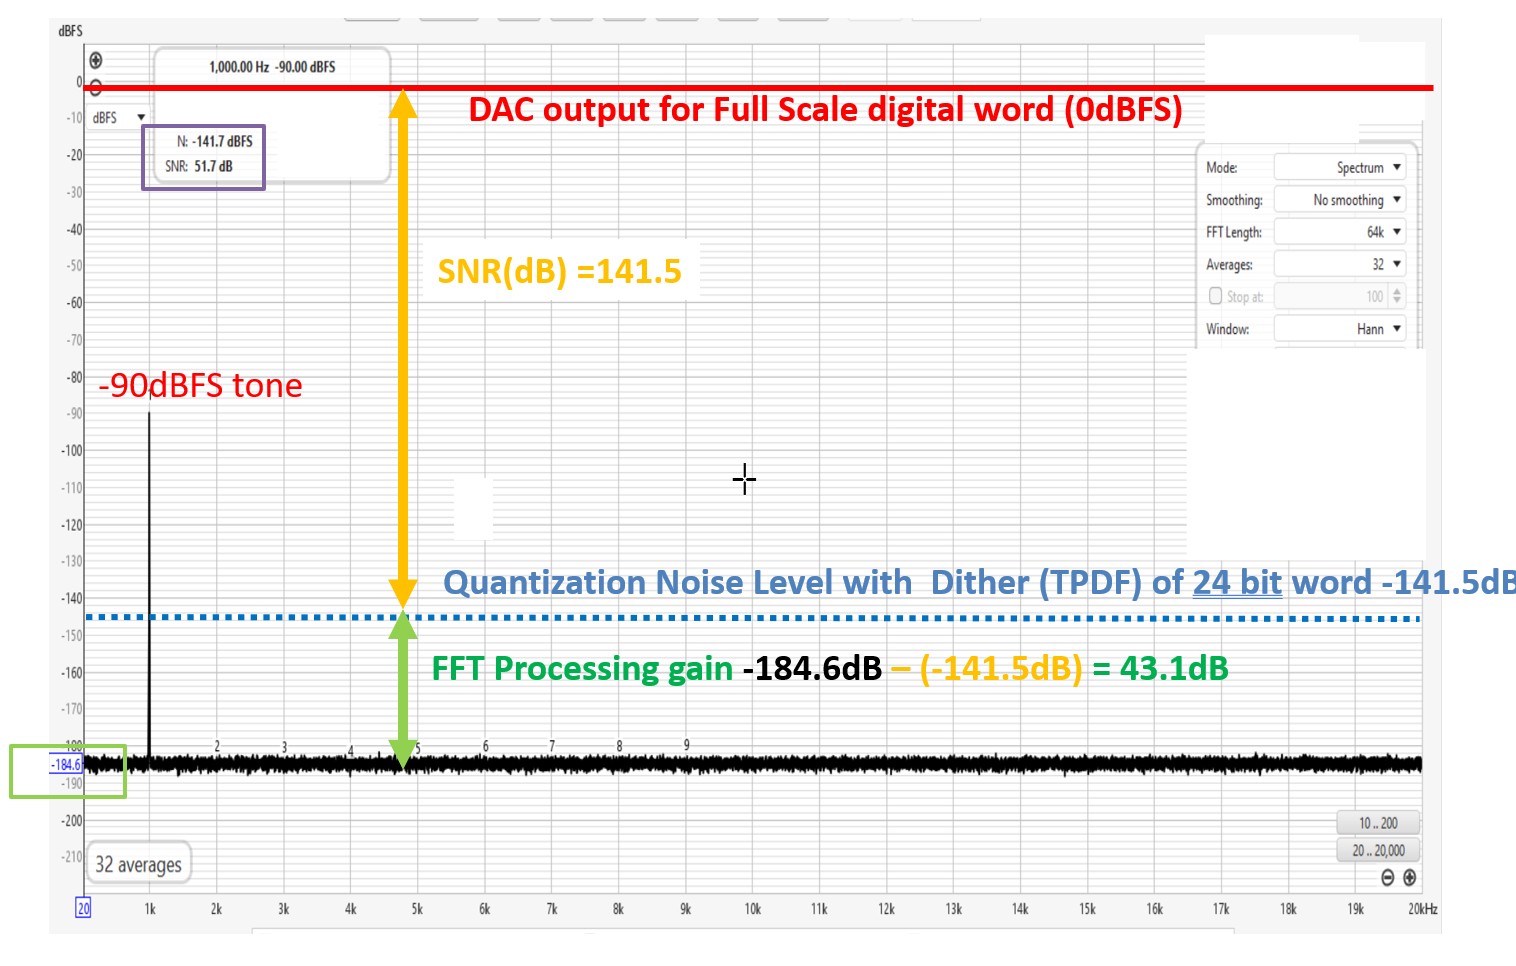 Figure 6 Processing gain calculation with a 24-bit word with dither
In Figure 6 above, I have inserted a yellow arrow indicating the Full-Scale SNR (dynamic range) of the 24-bit DAC with dither, which we calculated as 141.5dB. The top of the arrow is at Full-Scale. The dotted blue line is the noise level defined by the end of the yellow arrow.
I have marked the difference between the DAC converter’s noise and the spectra noise floor with a green arrow. What is the value of the green line, and what caused the reduction in the FFT spectra noise floor?
The noise floor has dropped from -93.3dB in the earlier 16-bit simulation to -141.5dB, as we just calculated above.
The spectra show the FFT noise floor is again lower by 43.1dB. This is about the same difference we saw in Figure 5 when 16-bit data was used. The small computational difference is due to working with very low noise levels in the 24-bit case. Therefore, we see that the processing gain remains constant regardless of bit depth.
We have demonstrated that the processing gain remains constant, provided the FFT size does not change, even as the system noise changes.
Direct measurement of SNR by REW in the presence of a signal
It is possible to measure noise directly from an FFT by counting the noise in each bin except for the bins with the fundamental and harmonics. I am simplifying here so I do not have to discuss the issue that noise in the bins has units of power, not voltage. The actual calculation is not very different from what I described in the first sentence.
In the REW figures 3-6, I have highlighted the direct noise calculation in a box. You can see we get a noise level of -93.5dB with the 16-bit tone and dither. This is the expected value with a slight 0.2dB error.
For the 24-bit tone with dither, the SNR on the REW graph is -141.7dB. Again, this is within 0.2dB of the expected value. It is hard to identify which part of the calculation — from REWs’ generation of the tone with dither to the FFT calculation to the noise calculation from the FFT results —accounts for the small error.
Many spectral analysis tools cannot perform the measurement outlined above. They cannot identify the bins that contain only noise.
SpectraPlus does not do it, and it isn’t easy with the Audio Precision SYS 2722.
The technique is standard on the newer Audio Precision APx5220. It is also found on the inexpensive USB-based spectrum analyzer QuantAsylum QA403.
Understanding when dither needs to be accounted for in the SNR calculation.
The digital-to-analog converter noise swamps the dither at the 24-bit level. To make this clear, I calculated the change in SNR caused by the 24-bit TPDF dither. For an 18-bit converter (SNR 110dB), I calculated the presence of 24-bit TPDF dither noise. The dither changed the SNR by 0.005dB, which is clearly negligible.
18 bits of resolution is typical of stereo components sourced by name-brand companies and sold through dealers. For multichannel products, 18 bits are achieved only by one component, the Marantz AV20, now under test at Secrets.
As technology advanced, we now have isolated stereo DAC boxes that achieve actual 21-bit performance (128dB). Still, the 24-bit dither contribution is minimal with an SNR change of 0.2dB. The Topping D90SE we measured has an SNR of 130dB, so the actual SNR should have been reported at 129.8dB.
https://hometheaterhifi.com/reviews/dac/topping-d90se-dac-review/
For a 16-bit digital test stimulus, the measured noise increases due to the added dither. The TPDF dither is added at the 16th bit level, resulting in a 4.77 dB reduction in SNR. This is a large difference and must be accounted for if the processing gain is being calculated from this known 16-bit dithered noise source.
The Real World
We return to a 16-bit digital-to-analog converter. This time we have a real system, not a computer simulation. The real DAC box is receiving an ideal computer-generated .wav from SPDIF or USB. The DAC being used has a performance well in excess of 16 bits, so we expect it will produce an SNR =93.31dB with a 16-bit .wav file.
The ADC converter used to produce the spectra with the SpectraPlus display tool also has an SNR well in excess of -93.31dB
In the real world, DAC boxes produce voltages ranging from 2VRMS to 6VRMS when the .wav file is 0dBFS. Usually, DACs produce 2VRMS or 6dBV for RCA out and 4VRMS, which is 12dBV for XLR out.
In this figure, we have used a display of the relative values on the Y axis. This is expressed in dBr. With dBr, the Full-Scale (0 dBFS) is always shown as 0 dBr
dBV is typically shown in a Secrets review on the Y-axis. In Figure 10 below, I will show how to work with a typical Secrets spectrum.
The tone to ensure the DAC is operational at 1kHz needs to be much smaller than full scale (0dBFS) to prevent distortion from the DAC under test. In this test, a -90dBr signal was used
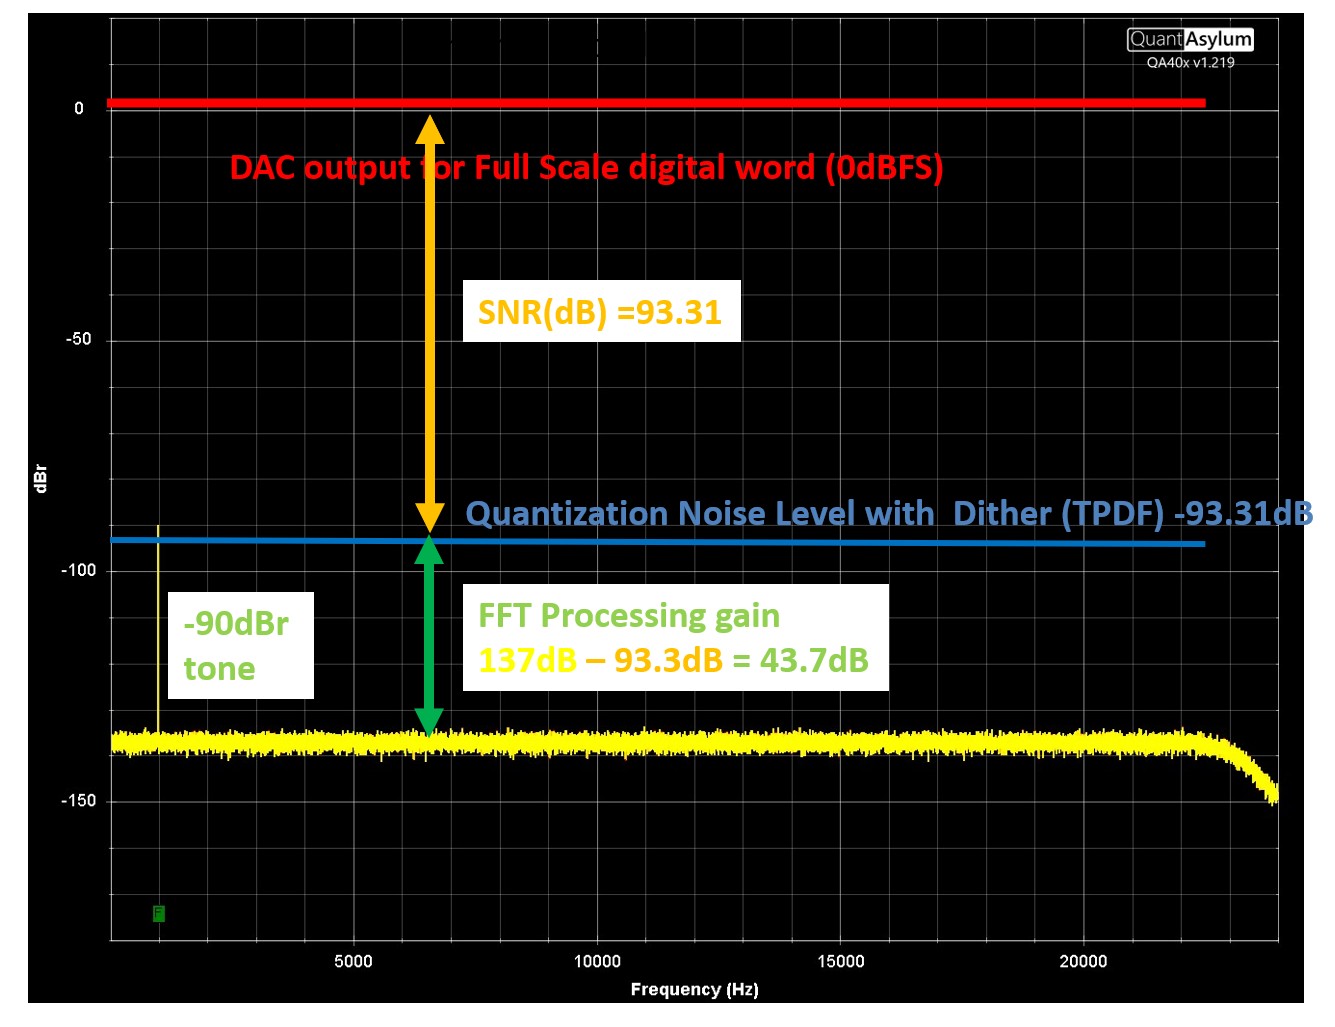 Figure 7 Spectra of a 16-bit dithered .wav file in a real DAC box
Note how similar Figure 7 looks to Figure 4 of the REW spectra for the ideal case, with no analog electronics in the signal path. The difference in the processing gain of SpectraPlus, used for Figure 7 -10, is about 43.7dB instead of the value of 43dB for REW.
Note in the figure above, I am presenting numbers to 0.1 accuracy. From a graph, without cursor marks, such accuracy is impossible. It was possible with the REW graphs in figures 3 -6 since those had cursors to display the absolute value of the noise line. The reader will appreciate that maintaining accuracy is more of a demonstration of how the calculations would be made if a cursor had been used for these plots.
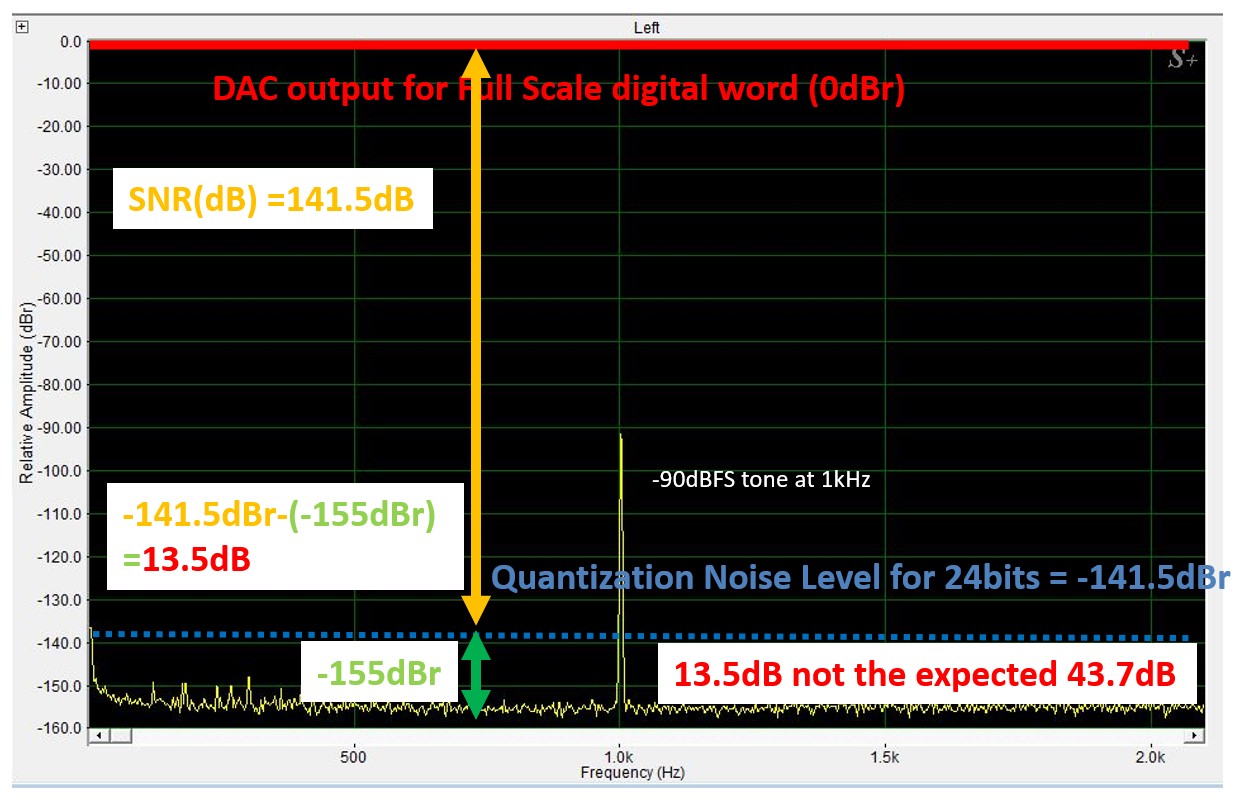 Figure 8 Spectra of a 24-bit dithered .wav file in a real DAC box
Now we look at what happens when a DAC box with an SNR of 111dB is sent a test signal from a dithered 24-bit .wav file with a 1kHz tone at 0 dBFS. This is shown in Figure 8.
Again, the tone to ensure the DAC is operational at 1kHz needs to be much smaller than full scale (0dBFS) to prevent any distortion. The tone was set to -90 dBFS, which produced a -90 dBr tone on the spectrum.
As shown in the graphs above, I drew an arrow to the value of -141.5dB, which corresponds to the SNR of an ideal 24-bit word. This has been discussed in detail above.
The DAC output noise is shown in green. It is clearly displaced by a much smaller value than the 43dB processing gain predicts. What is the data in Figure 8 trying to tell us?
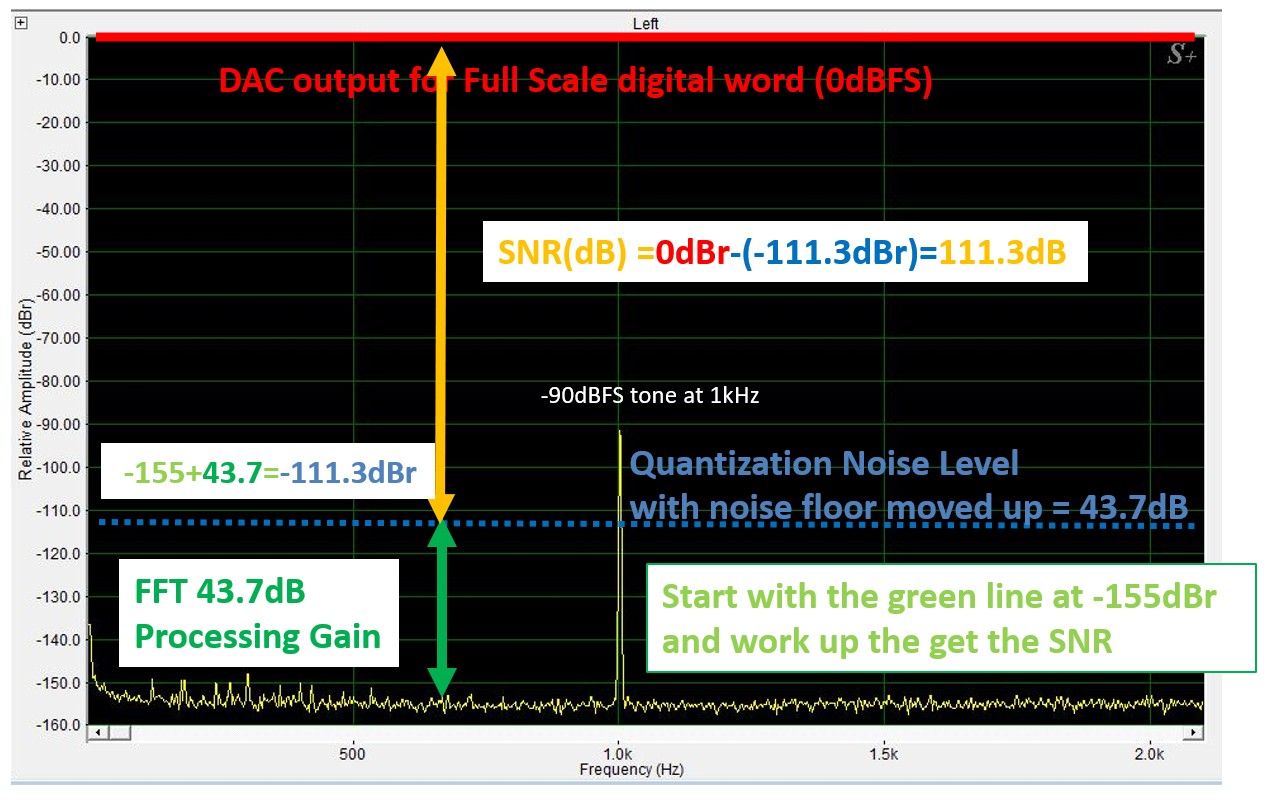 Figure 9 Method to calculate the SNR of a real DAC box
This is the same spectrum as Figure 8. Here, I am using the green line as a reference at -155dBr. I use the known processing gain of 43.7dB for SpectraPlus, shown by the green arrow. I then draw a quantization noise level 43.7dB higher, which is -111.3dBr.
-155dBr + 43.7dB = -111.3dBr
Note that the processing gain is an absolute number. I use dB, not dBV or dBr. The calculation output maintains dBr units.
I then drew a yellow arrow from the quantization noise to the 0 dBFS signal level at the DAC, which is 0 dBr. The result is a yellow arrow with a value of 111.3dB.
0dBr – (-111.3dBr) = 111.3dB
Note: I am now subtracting dBr units. The 111.3dB result is an absolute number because I subtracted two dBr values.
What is this yellow arrow? It is the DAC’s SNR.
In producing the graphs above, a very high-performance ADC with an SNR of 120dB was used so that we could ignore ADC noise.
For figure 7, I used the ideal SNR of a DAC fed with a 24-bit .wav file, which is 141.5dB. The real DAC in this test is performing well below the ideal. Let’s calculate the Effective Number of Bits (ENOB).
The formula for ENOB is based on the theoretical maximum SNR of an ideal N-bit converter, which is given by the equation:
SNRideal=(6.02×N+1.76)dB.
To find ENOB for a DAC, you simply substitute the DAC’s measured SNR (in decibels) into the formula below and solve for N, which now becomes the ENOB.
The resulting formula is:
ENOB = (SNR DAC-1.76)/6.02
(111.3dB – 1.76)/6.02= 18.2bit
The calculated ENOB from the spectrum is 18.2 bits.
If the display tool can process data from the DAC with a signal present, none of the calculations above are required. Unfortunately, most of the spectra shown in Secrets are from the SpectraPlus or the Audio Precision SYS 2722, which cannot do this. See the section above on direct measurement of SNR in the presence of a signal.
Working with spectra in dBV instead of dBr
In most Secrets reviews, the spectra are presented in dBV, not dBr. This makes the SNR calculation a little more complicated, as shown in the graph below.
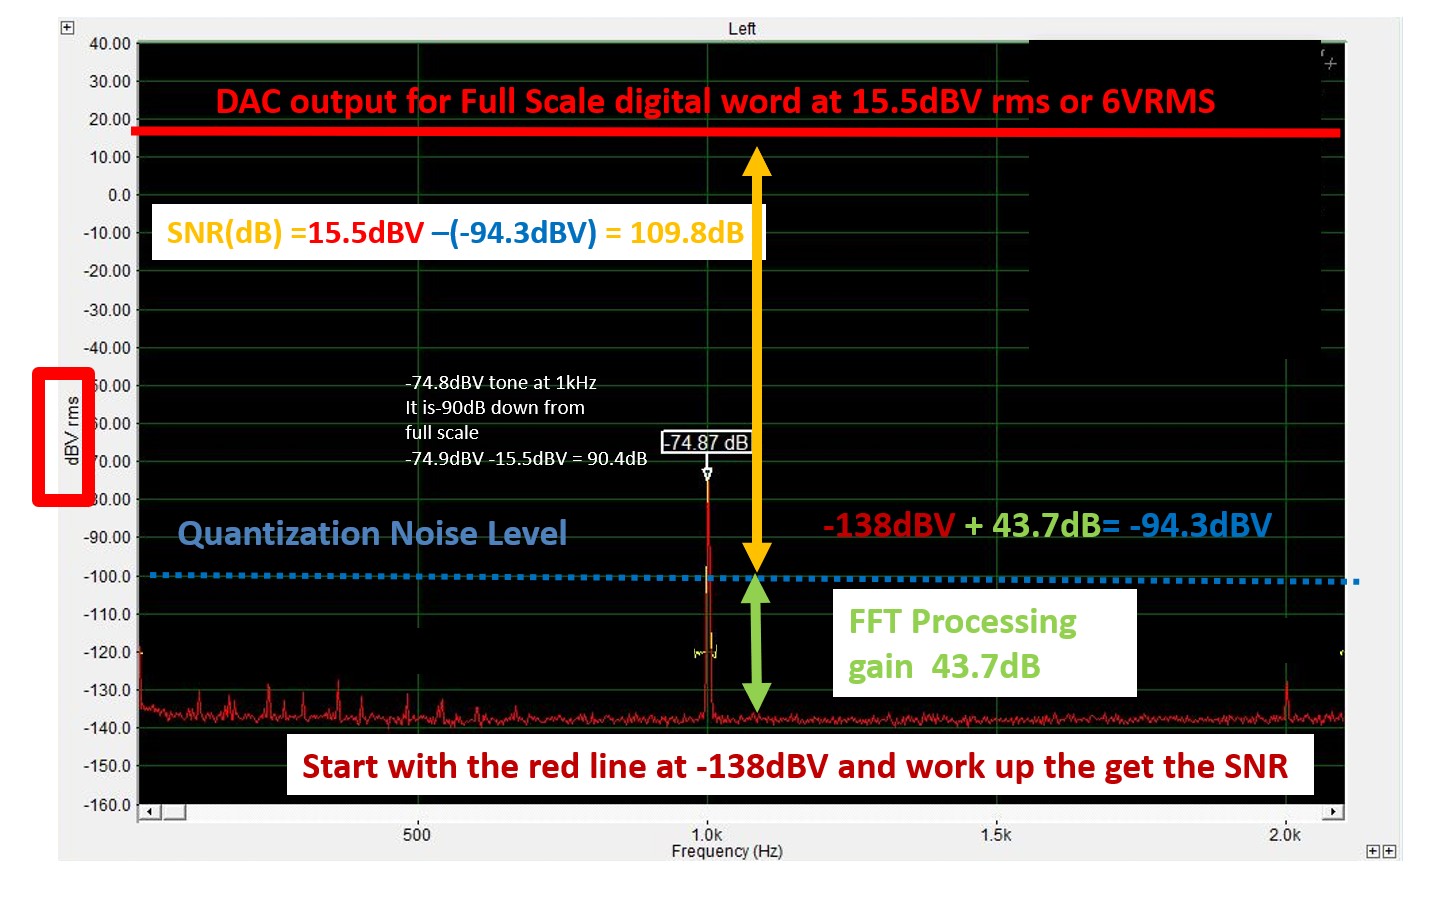 Figure 10 Using a spectra with a Y axis in dBV to calculate SNR
The DAC being tested in this example is the same one used for Figures 8 and 9. The DAC under test was sent a 24-bit .wav file. The output of this DAC would have been 6VRMS at its XLR outputs if driven by a 0dBFS signal. This is slightly higher than the standard XLR output level for a DAC, but it is what this DAC puts out.
VRMS is 15.5 dBV, as shown at the top of the spectra above.
The tone to ensure the DAC is operational at 1kHz needs to be much smaller than full scale (0dBFS) to prevent any distortion.
The 1kHz tone is 74.8 dBV in this example.
The relative value is 74.9dBV – 15.5dBV = -90.4dB.
We sent a -90dBFS tone to the DAC. The small error is from the analog DAC-ADC loop.
Now we calculate the SNR from this plot. I am using the red line as a reference at -138 dBV.
I use the known processing gain of 43.7dB, shown by the green arrow.
I then set the quantization noise level to 43.7dB higher, which is -94.3 dBV.
-138dBV + 43.7dB = -94.3dBV.
Note that the processing gain is an absolute number. I use dB, not dBV or dBr. The calculation output maintains dBV units.
I then drew a yellow arrow from the quantization noise to the 0 dBFS signal level at the DAC, which is 15.5 dBV, as explained above. The result is a yellow arrow with a value of 109.8dB.
15.5dBV – (-94.3dBV) = 109.8dB
Note: I am now subtracting dBV units. The 111.3 result is an absolute number because I subtracted two dBV values.
What is this yellow arrow? It is the DAC’s SNR.
Figures 8–10 show the same DAC. The spectra in dBV (Figure 10) were measured at a different time than the plot above, which is in dBr (Figure 8-9). The signal-to-noise for the dBr plot was predicted to be 111.3dB, but the dBV plot predicts -109.8. Some of this error is random error from the two different setups. A significant part of the error is that it is hard to estimate the exact value of the lines without a cursor. SpectraPlus does have a cursor function, but we did not use it for these plots, and it is not typically used in Secrets reviews.
Note that, in our reviews, Secrets uses a Lynx sound card for the ADC. The ADC of the Lynx card is about 110dB.
The Lynx card, at its limit, produces a noise floor with a processing gain of 135dB when the SpectraPlus display tool is used, driven by a DAC with an SNR of -115dB or higher.
The spectra for the Lynx card in SpectraPlus would look just like the graph above if the DAC driving the Lynx board ADC had an SNR well in excess of 120dB.
An ADC with an SNR of 110dB driven by a DAC with an SNR of 110dB would produce a noise level 3dB lower than the DAC’s performance. This occurs because the ADC and DAC noise are equal.
The Quantasylum QA403, which Carlo is using in his latest reviews, has a significantly better SNR range of 120dB. The QA403 can also produce SNR in the presence of noise, so the SNR can be read as a number presented on the spectra that the QA403 produces. THD also improves over the Lynx, with a -125dB THD when driven by a very high-quality source.
Calculating the Processing Gain of an Audio Precision SYS2722
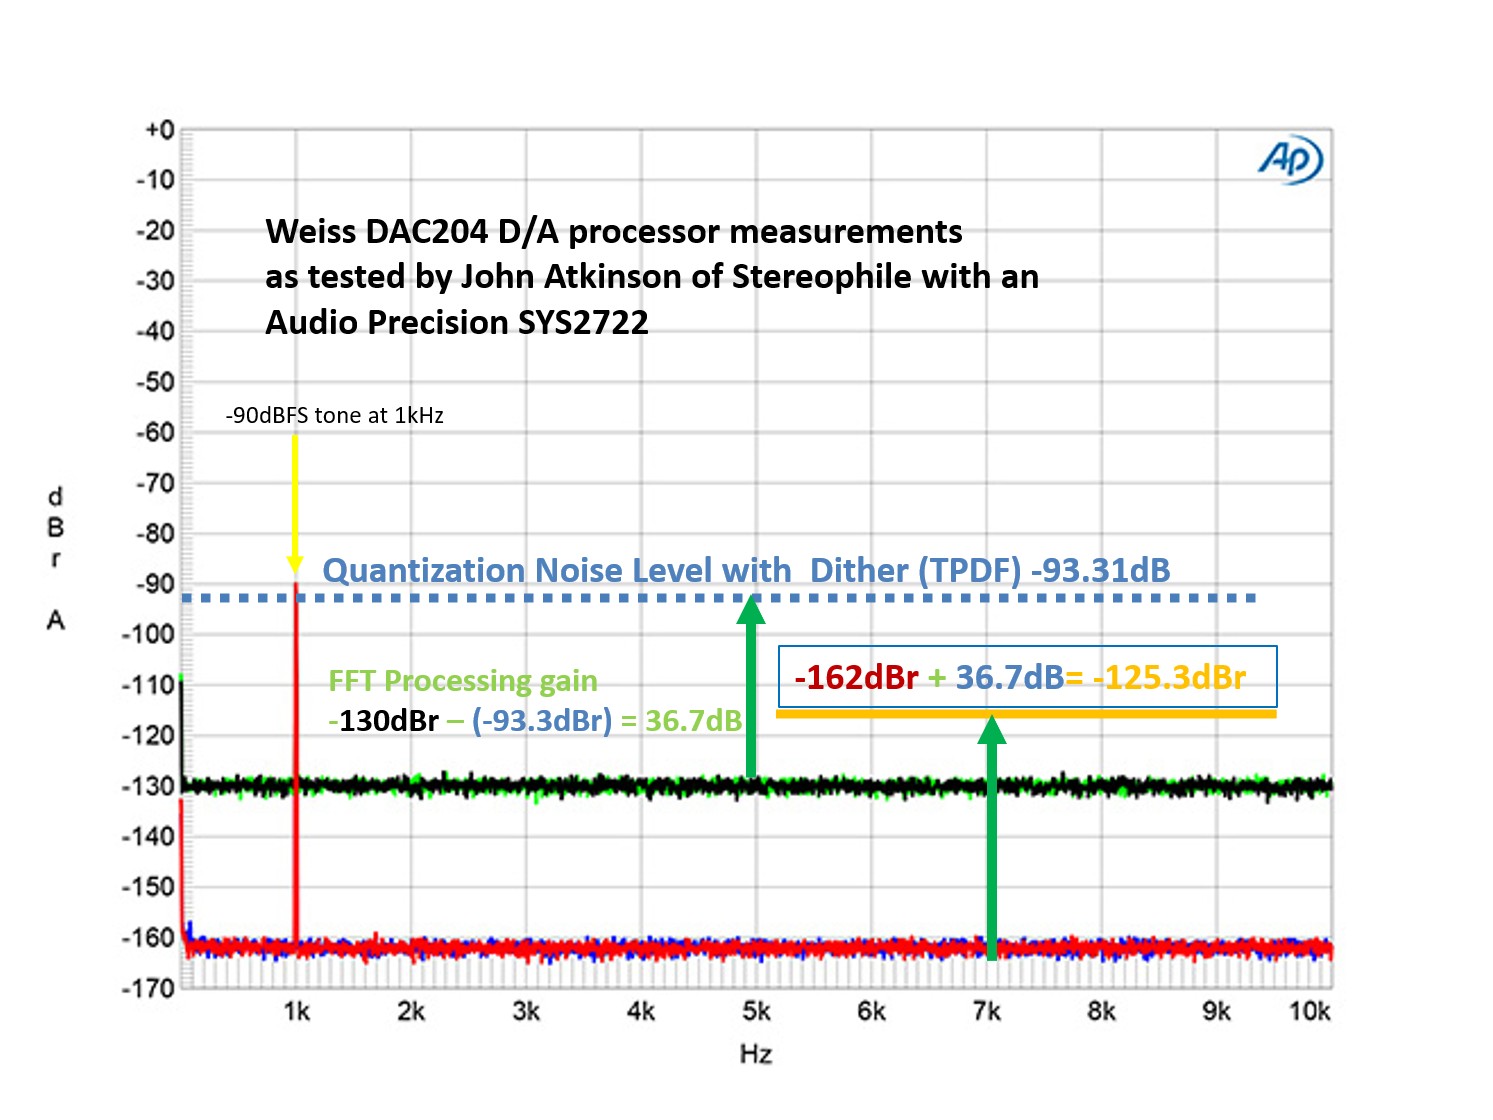 Figure 11 Using a spectra from an AP SYS2722 to calculate SNR
As a final example, I used a graph published in Stereophile showing the performance of the Weiss DAC204 D/A processor, as tested by John Atkinson. This is used with permission from Stereophile. It is Figure 6 of the measurements section in the Stereophile review.
https://www.stereophile.com/content/weiss-dac204-da-processor-measurements:
“Weiss 204, spectrum with noise and spuriae of dithered 1kHz tone at –90dBFS with 16-bit data (left channel green, right gray) and 24-bit data (left blue, right red) (20dB/vertical div.)”.
An Audio Precision SYS2722 produced this graph.
With both the 16-bit and 24-bit levels on the same plot, it is easy to see the process of getting the ENOB of this DAC.
This graph is in dBr. For the 16-bit data word, the noise floor is -130dB. Recall that the noise of a 16-bit dithered word is 93.3dB. We can now calculate the processing gain.
-130dBr – (-93.3dBr) = 36.7dB
We have calculated the processing gain of the Audio Precision SYS2722 as 36.7dB. This is for a 32k FFT and a sampling rate of 48k samples/sec, used by John Atkinson. Reducing the FFT size from 64K in the previous figures to 32K reduces the processing gain by 3dB. If the Audio Precision SYS2722 had been set to 64k, the processing gain would have been 39.7dB.
Depending on the window used, the processing gain changes. The Audio Precision SYS2722 processing gain is 39.7dB, with a 64k FFT. It is achieved through a special window:
https://www.ap.com/news/fft-scaling-for-noise
REW and SpectraPlus use similar windows to produce high-resolution spectra, which is why the processing gain showed only a small difference of 43.0dB and 43.7dB, respectively, but a 3dB difference compared to the Audio Precision SYS2722. The comparison is made with all display tools set to a 64k FFT.
Now that we have calculated the processing gain of the Audio Precision SYS2722 from Figure 11, we can calculate the ENOB of the Weiss DAC204 D/A processor when driven by a 24-bit dithered data word.
The D/A converter noise level is calculated by subtracting the Audio Precision SYS2722 processing gain of 36.7dB from the noise floor on the plot, which is -162dBr.
-162dBr + 36.7dB = -125.3dBr
The noise level of the Weiss DAC204 D/A processor, as determined from Figure 11, is 125.3 dB.
We can now calculate this product’s ENOB (Effective Number of Bits):
ENOB = (SNR DAC-1.76)/6.02
With a noise level of -125.3 dB, the converter has an ENOB of 20.5 bits.
ENOB = (125.3dB-1.76)/6.02 = 20.5bits
It is hard to get an exact number from the Y-axis of the small graph. We could easily be off by +/- 0.3bits.
The Audio Precision SYS2722 can measure a DAC with an ENOB exceeding 21 bits.
The Audio Precision SYS2722 that produced this graph is the same unit that the publisher, Dr. John Johnson, has; however, he has never presented the graph shown in Figure 11. You can use the process outlined here to estimate SNR from his past reviews, but make sure you are using 24-bit data. Also, the plots are typically in dBV, with a signal of -5 dBFS. The plots in Secrets only show 16-bit or 24-bit data; no reference line for 16-bit data is provided. You will find 16-bit data in other plots in the same review so that you can estimate the processing gain. It just takes more work. You will need to use the process shown in Figure 10 for dBV graphs to obtain the correct SNR for these plots.
Secrets Sponsor
Take aways
We have shown that the noise floor of an FFT spectral plot is not the device under test’s signal-to-noise ratio.
The FFT’s Processing Gain reduces the noise floor. The value of the processing gain depends on the FFT size, the data sampling rate, and the type of post-processing window.
We showed that the processing gain is constant, provided the FFT size and sampling rate remain constant, across different signal-to-noise ratios.
The noise level of the FFT spectra is related to the device-under-test’s actual noise level by the FFT’s processing gain.
SNR can be calculated from a spectra plot using the FFT noise floor and knowledge of the value of the processing gain.
When an FFT plot is presented in a review, the value of the processing gain needs to be specified if the reader is attempting to extrapolate the noise performance of the product from the plot.
Processing gain allows small signals and distortion components to be displayed that would be hidden if an FFT were not used to produce the spectra.
Basic technical information about the FFT, useful for this article (optional section).
FFT is an acronym for Fast Fourier Transform.
Ignore the Fast, which has to do with an algorithm to speed up the computation of a Discrete Fourier Transform. The discrete indicates we can do this with numbers on a computer.
What I really need to do is define the Fourier Transform (discrete or continuous) without any math. The Fourier Transform converts a time-domain signal into the frequencies contained in that signal. Wikipedia has the best analogy:
“in a way similar to how a musical chord can be expressed as the frequencies (or pitches) of its constituent notes”.
https://en.wikipedia.org/wiki/Fourier_transform
Below is a nifty illustration of what the Fourier transform does. This is also from Wikipedia.
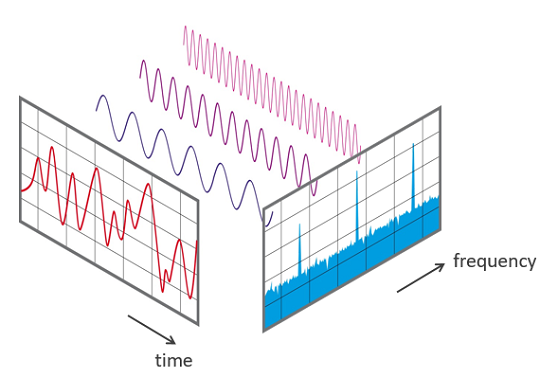 View of a signal in the time and frequency domain
https://en.wikipedia.org/wiki/File:FFT-Time-Frequency-View.png
The Discrete Fourier transform converts the samples of the signal, as found on a CD, into samples from the Fourier transform. In other words, the time domain samples are converted to frequency domain samples. Those frequency domain samples are called bins. The number of samples in the time domain are converted to half the number of bins in the frequency domain.
If we collect M samples in the time domain. The Discrete Fourier transform then divides the frequency into M/2 slices (M/2).
As an example, if we collect (65536) samples (M), which is typical, then the frequency spectrum is divided into 32768 slices (M/2).
M/2 = 65536 samples / 2 = 32768 Discrete Fourier transform bins.
Why are we using the specific number of 65536? That comes about because we are doing digital (discrete) computations on a computer. The 65536 is the word size for 16 bits.
Therefore, 216 = 65536.
The discrete frequency components fall into what’s called “individual bins”. These bins will show the fundamental, tone(s), and harmonics of the fundamental and the intermodulation products. Nothing new here, you have been looking at these spectra for years when you look at the Secrets measurement section. We have been calling this a spectrum, but what you are looking at is a sampled spectrum. With 32768 bins, it smears into what looks like a continuous plot.
We are not restricted to 16 bits. Reducing the number of bits speeds up the calculation, while increasing the number of bits increases the resolution. While we do not need more resolution to make the plots look continuous, it will help when noise enters into the picture. This article is on how the noise changes the spectrum.
For whatever reason, when a spectrum of a Discrete Fourier transform plot is shown, it will be called an FFT. Here is how Wikipedia explains it.
“An FFT (Fast Fourier Transform) computes the DFT (Discrete Fourier transform) and produces exactly the same result as evaluating the DFT definition directly; the most important difference is that an FFT is much faster”.
https://en.wikipedia.org/wiki/Fast_Fourier_transform
As you would expect, over time, many algorithms have been developed. The Wikipedia article describes them in detail. Some take less computational time than others, but the term “Fast” is applied to all of them.
Also see Dr. Johnson’s article in Secrets on Fast Fourier Transforms:


