Music consists of hundreds of simultaneous sine waves created by all of the instruments playing at the same time. The sine wave is the basic unit of music.
When audio equipment is tested, individual or paired sine waves are created, passed through the audio equipment, and the resulting analog signal is passed back into the spectrum analyzer. It digitizes the analog signal and then creates a spectrum that shows the details of what the audio signal consists of. This is a mathematical process.
The general calculus formula for a sine wave is:
Where:
● A is the amplitude (peak value of the wave),
● ω is the angular frequency (ω=2πƒ, where ƒ is the frequency),
● t is time,
● φ is the phase shift (horizontal shift of the wave).
Derivative of a Sine Wave:
Differentiating y(t) with respect to t:
dy/dt = Aω cos(ωt+φ)
This shows that the derivative of a sine function is a cosine function, scaled by Aω
Second Derivative:
Differentiating again:
d2y/dt2 = −Aω2 sin(ωt+φ)
This shows that the second derivative of a sine wave is proportional to the negative of the original function.
The angular frequency (ω) and the frequency (ƒ) of a sine wave are related by the formula:
ω=2πƒ
Where:
● ω (angular frequency) is measured in radians per second (rad/s).
● ƒ (frequency) is measured in Hertz (Hz), which is cycles per second.
Explanation:
● The frequency ƒ tells us how many complete cycles the sine wave completes in one second.
● The angular frequency ω tells us how many radians the wave progresses per second. Since one complete cycle corresponds to 2π radians, we multiply the frequency by 2π to convert to angular frequency.
For example, if a sine wave has a frequency of ƒ=1 Hz, then its angular frequency is:
ω=2π×1=2π rad/s
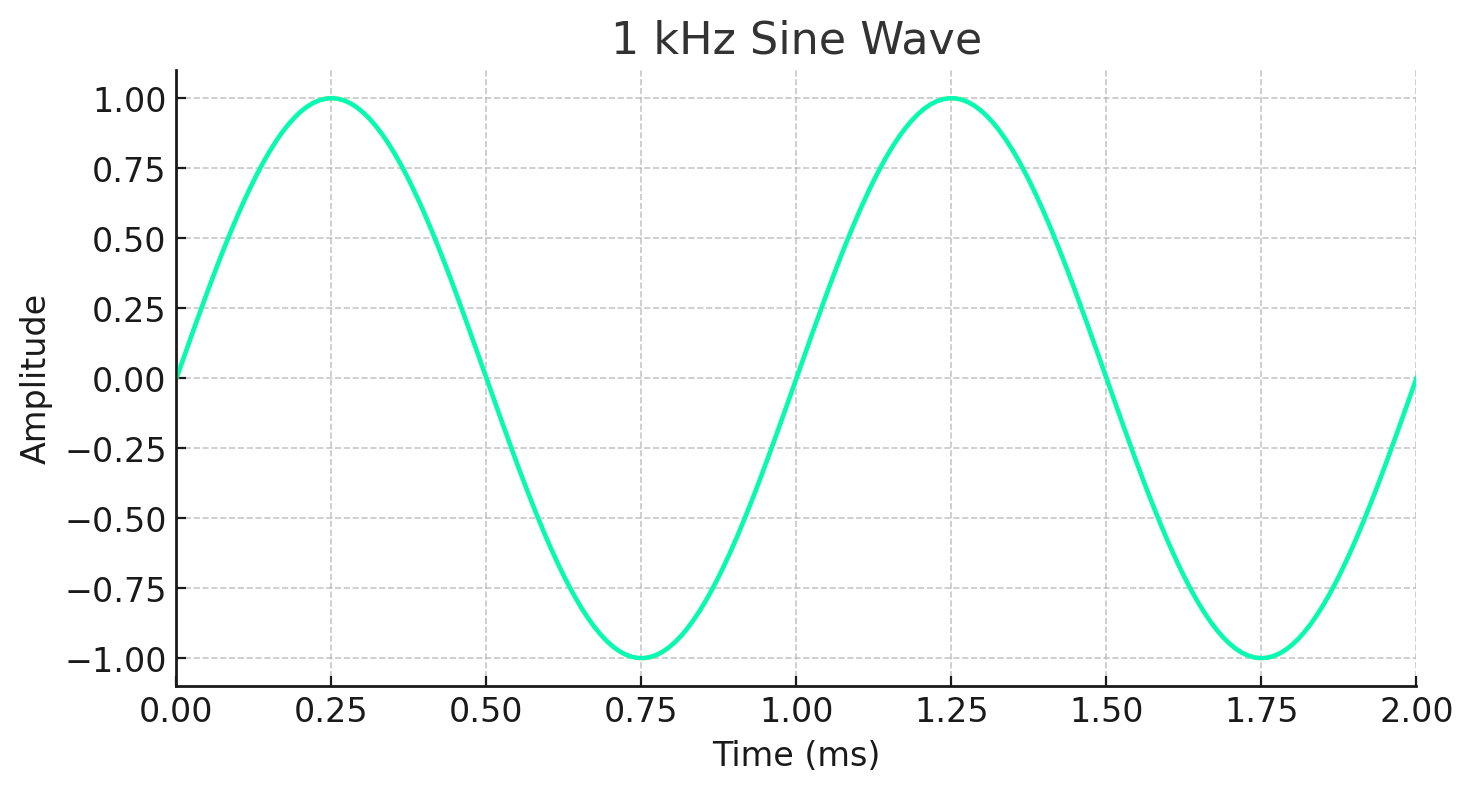
Let’s take a 1 kHz sine wave as an example and plot it using the formula:
y(t) = Asin(2πƒt+φ)
Given Parameters: Frequency: ƒ = 1000f =1000 Hz
● Amplitude: A = 1 (for simplicity)
● Phase Shift: φ = 0 (no phase shift)
● Time Range: Let’s plot from 0 to 2 milliseconds (2 ms, 0.002 seconds)
Since the frequency is 1,000 Hz, you can see that it completes one full cycle every 1 millisecond.
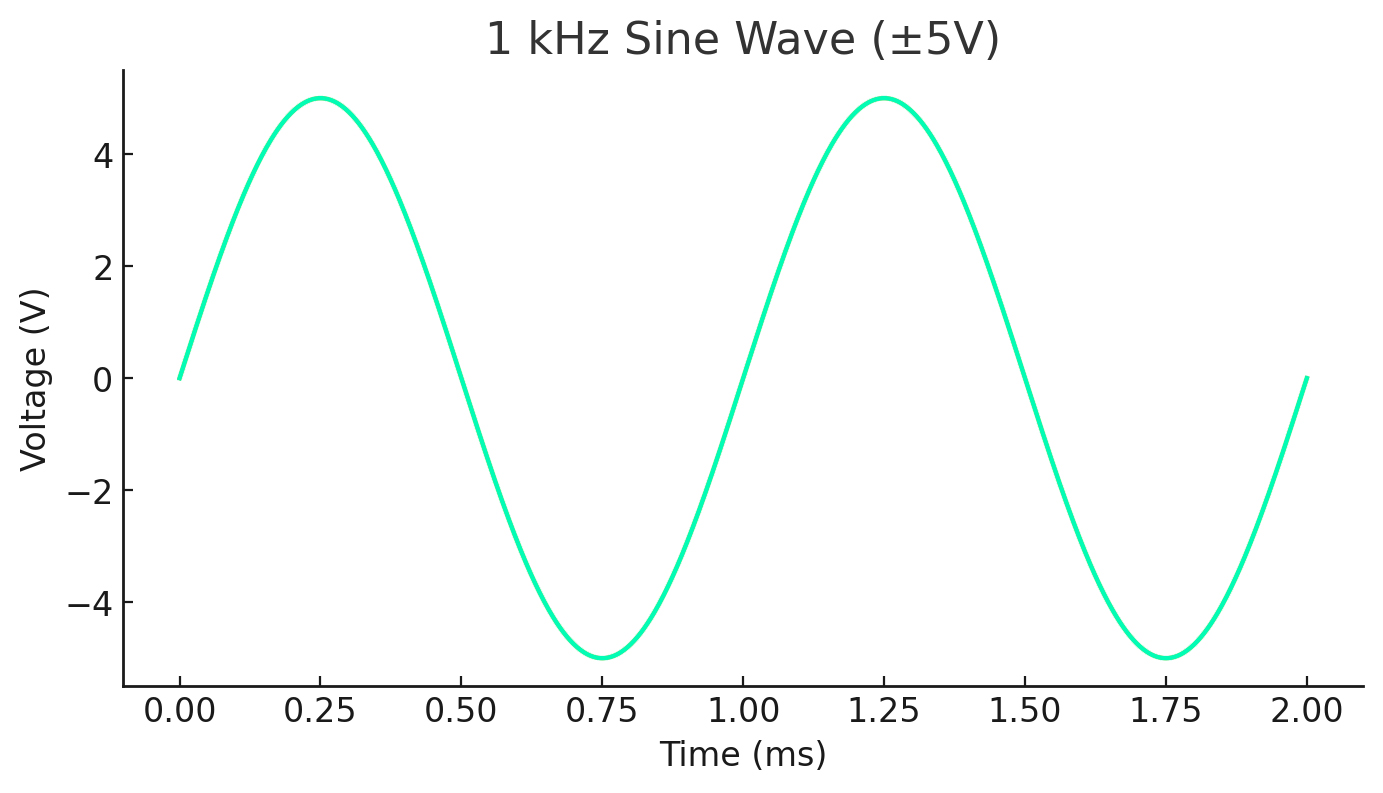
When examining a sine wave in a digital oscilloscope, the sine wave will have Voltage on the Y axis. This is plotted as follows:
A sine wave for voltage is generally represented as:
V(t) = Vms2 (πƒt+φ)
Where:
● V(t)) is the instantaneous voltage at time t,
● Vm is the peak voltage (amplitude),
● ƒ is the frequency in Hz,
● φ is the phase shift (in radians),
● t is the time in seconds.
Secrets Sponsor
1. Choose Parameters
● Example: Vm = 5V, ƒ = 1 Hz, φ = 0
2. Generate Time Values
● Create a time vector covering at least one full cycle (T=1/ƒ).
3. Compute Voltage Values
● Apply the sine function to compute V(t).
4. Plot the Wave
● Use a graphing tool like Python (Matplotlib) or MATLAB.
Example in Python
pythonCopyEdit
import numpy as np
import matplotlib.pyplot as plt
# ParametersVm = 5 # Peak voltage (V)
f = 1 # Frequency (Hz)
phi = 0 # Phase shift (radians)
t = np.linspace(0, 2, 1000) # Time from 0 to 2 seconds (enough for 2 cycles)
# Voltage equationV = Vm * np.sin(2 * np.pi * f * t + phi)
# Plottingplt.plot(t, V)
plt.xlabel(‘Time (s)’)
plt.ylabel(‘Voltage (V)’)
plt.title(‘Sine Wave Voltage’)
plt.grid()
plt.show()
Here is the plot of a 1 kHz sine wave that peaks at +5 Volts and -5 Volts over time (10 Volts peak-to-peak, 5 Volts peak). Calculating the RMS value from the 5 Volts peak is 5 Volts divided by the square root of 2 = 5/1.41 = 3.55 Volts RMS. We use RMS voltage in day-to-day calculations because it is the DC voltage equivalent of the amount of heat that is produced by the peak AC voltage passing through a resistor.
So, 3.55 Volts DC passing through a resistor produces the same amount of heat that 5 Volts AC peak (not peak-to-peak) would by passing through that same resistor. That is because DC voltage is constant, while AC voltage varies as it passes through 0 Volts to a maximum positive peak, then back to 0, then to a maximum negative peak, then back to zero (60 times per second for 120 Volts AC in our wall sockets (USA). 170 Volts peak, 340 Volts peak-to-peak, is 120 Volts RMS, the USA wall socket voltage.
Secrets Sponsor
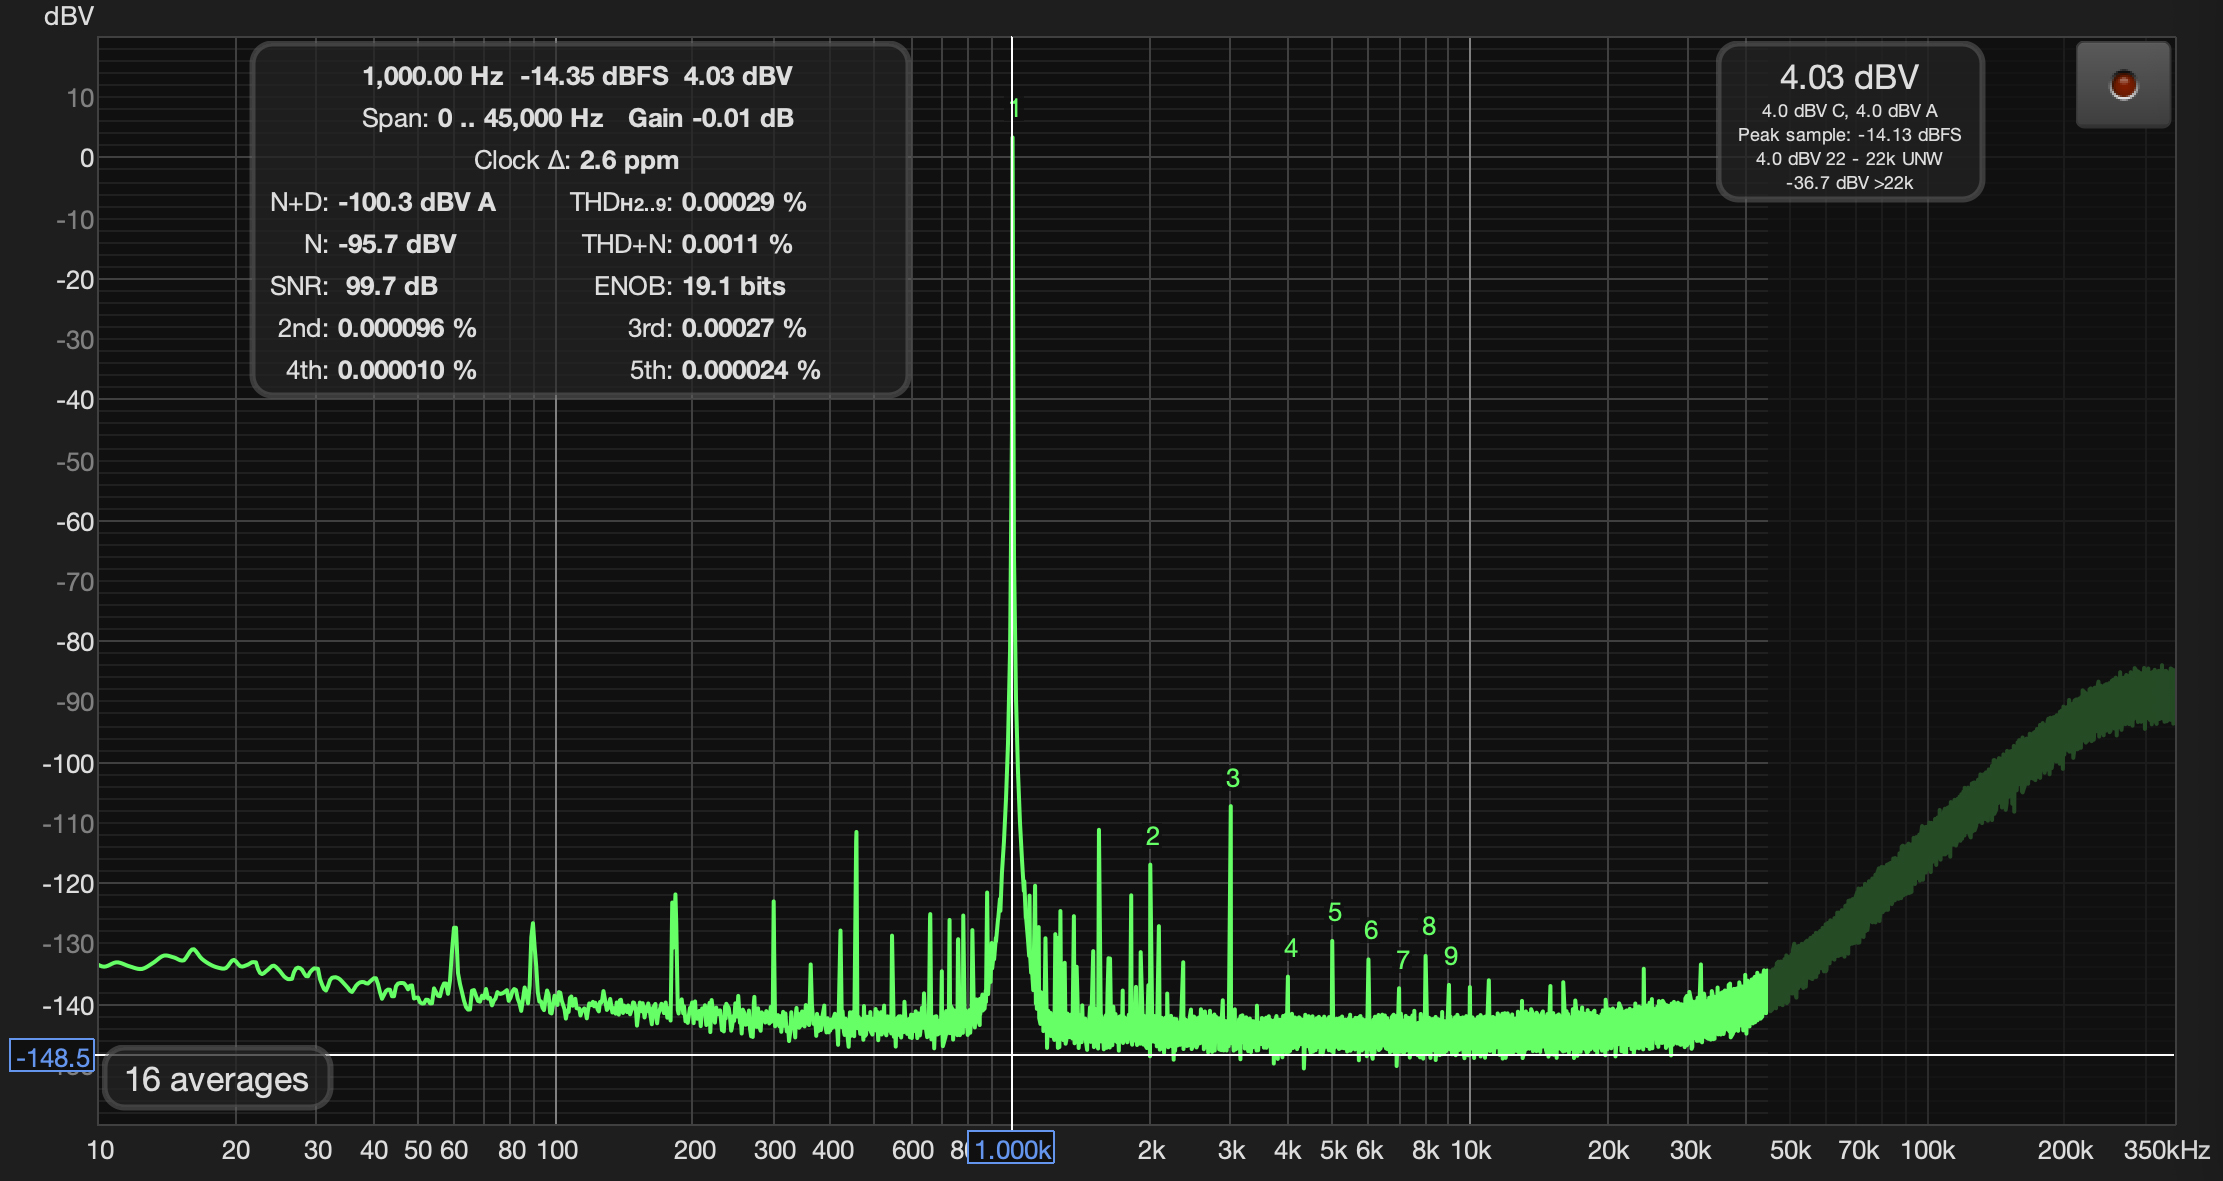
Fast Fourier Transform (FFT) analysis converts a time-domain signal into its frequency-domain representation, allowing us to analyze the signal’s frequency components and measure distortions.
How FFT Creates a Frequency Spectrum
1. Sampling the Signal:
- The signal is first sampled at a fixed rate (sampling frequency ƒs).
- A discrete set of time-domain values is obtained.
2. Applying FFT:
- The sampled signal undergoes FFT, a computationally efficient algorithm for the Discrete Fourier Transform (DFT).
- FFT deconstructs the signal into a sum of sinusoidal components of different frequencies.
3. Magnitude and Phase Calculation:
-
- The FFT produces a complex output containing real and imaginary parts.
- The magnitude spectrum is calculated as
-
- The phase spectrum is given by
4. Frequency Resolution:
- The FFT resolution is determined by ƒs/N, where N is the number of samples.
- A higher N results in a finer frequency resolution.
How FFT Helps in Distortion Analysis
1. Identifying Harmonics:
- If the input is a pure sine wave, any additional peaks in the frequency spectrum indicate harmonic distortion.
- Harmonics appear at integer multiples of the fundamental frequency f0f_0f0.
2. Measuring Total Harmonic Distortion (THD):
-
- THD is calculated as:
- This measures the power of harmonic components relative to the fundamental.
3. Detecting Noise and Intermodulation Distortion:
- FFT reveals non-harmonic distortion caused by nonlinearities.
- Intermodulation distortion appears as additional frequency components at sums and differences of original frequencies.
4. Observing Spectral Leakage and Windowing:
- If the signal length does not perfectly fit within the FFT window, spectral (FFT) leakage occurs.
- Windowing functions (Hann, Hamming, Blackman) reduce leakage and improve frequency accuracy.
By using FFT analysis, we can visualize the individual frequency peaks and quantify harmonic distortion in a signal.
So, here’s your takeaway: when we as techs talk about VAC, what we’re always actually talking about is RMS voltage, because that’s the voltage that’s practical to talk about. If you want to talk about peak voltage, you have to specify that that’s what you’re talking about. And if you see a sine wave alternating between 170-volt peaks on your oscilloscope when measuring household power, now you know why.


