I say “small” because they are petite in size. Their new JNOG3 (AKA J3 Pro) DAC is one example. There is no Bluetooth or wireless network capability, and I will explain why in this review.
Geshelli Labs JNOG3 DAC
- Compact
- Very low noise floor
- Easy to set up and use
- Multiple op-amp choices are available when ordering
- Can be highly personalized with a variety of case and finish options.
In the pursuit of high-fidelity audio reproduction, the quality of a Digital-to-Analog Converter (DAC) plays a crucial role. As the component responsible for translating digital audio data into the analog signals our ears can hear, the DAC acts as the gateway between the digital domain and the real world. Its performance directly affects tonal accuracy, detail retrieval, and spatial realism. While some audiophiles associate high-quality sound with bulky chassis and luxury features, the true measure of a DAC lies in its core function – conversion precision, low noise, and minimal distortion – not in its size or bells and whistles.
Today, many compact DACs offer exceptional performance at surprisingly modest prices. Advances in chip design and streamlined engineering have enabled manufacturers to focus resources on audio quality rather than secondary features like wireless streaming, touchscreen controls, or decorative casings. In fact, some of the most respected DACs on the market are simple, purpose-built devices that quietly outperform more elaborate competitors. When stripped of unnecessary complexity, a well-designed DAC – however small or affordable – can serve as a formidable front end in a high-end audio system, proving that good sound isn’t always tied to a hefty price tag or extravagant design.
DESIGN:
Digital-to-Analog Converter
DISTORTION:
0.003%
INPUTS:
Coaxial, Optical, USB, RCA Analog
OUTPUTS:
XLR Analog (two)
DIMENSIONS:
3.5” H x 7” W x 4.75” D
WEIGHT:
5 lbs.
MSRP:
$529.98 with an Aluminum case, AK4499 DAC Chip, and two TI OPA1656 Op-Amps (for XLR Balanced Outputs). Wood casework adds a $49.99 -$99.99 upcharge depending on species.
Website:
Company:
SECRETS Tags:
geshelli, dac, digital, op-amps, hifi, headfi
Secrets Sponsor
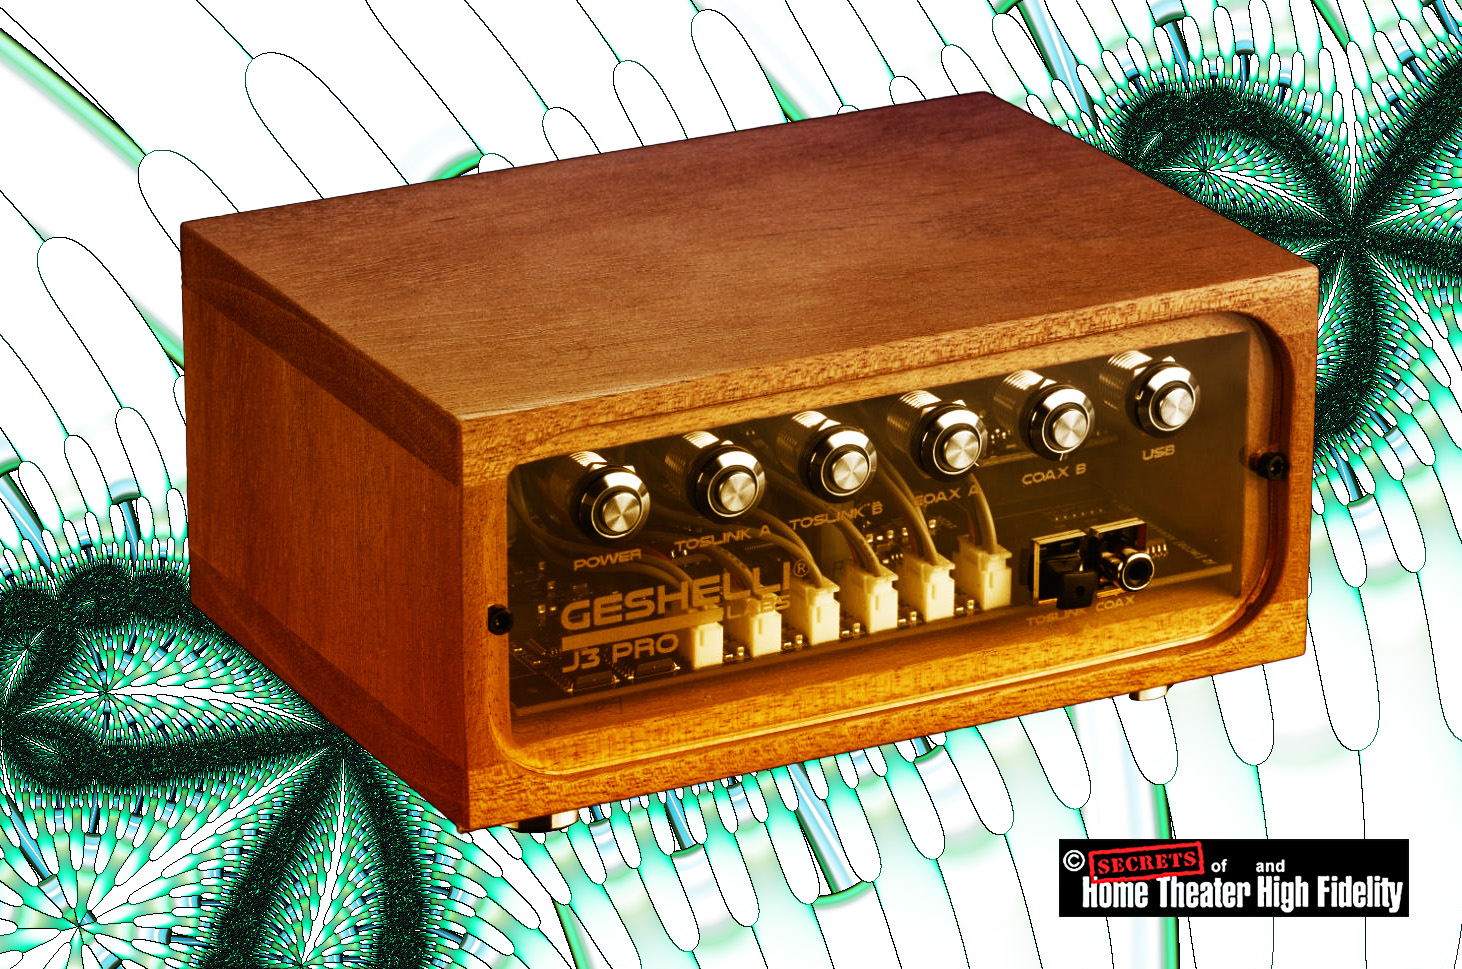
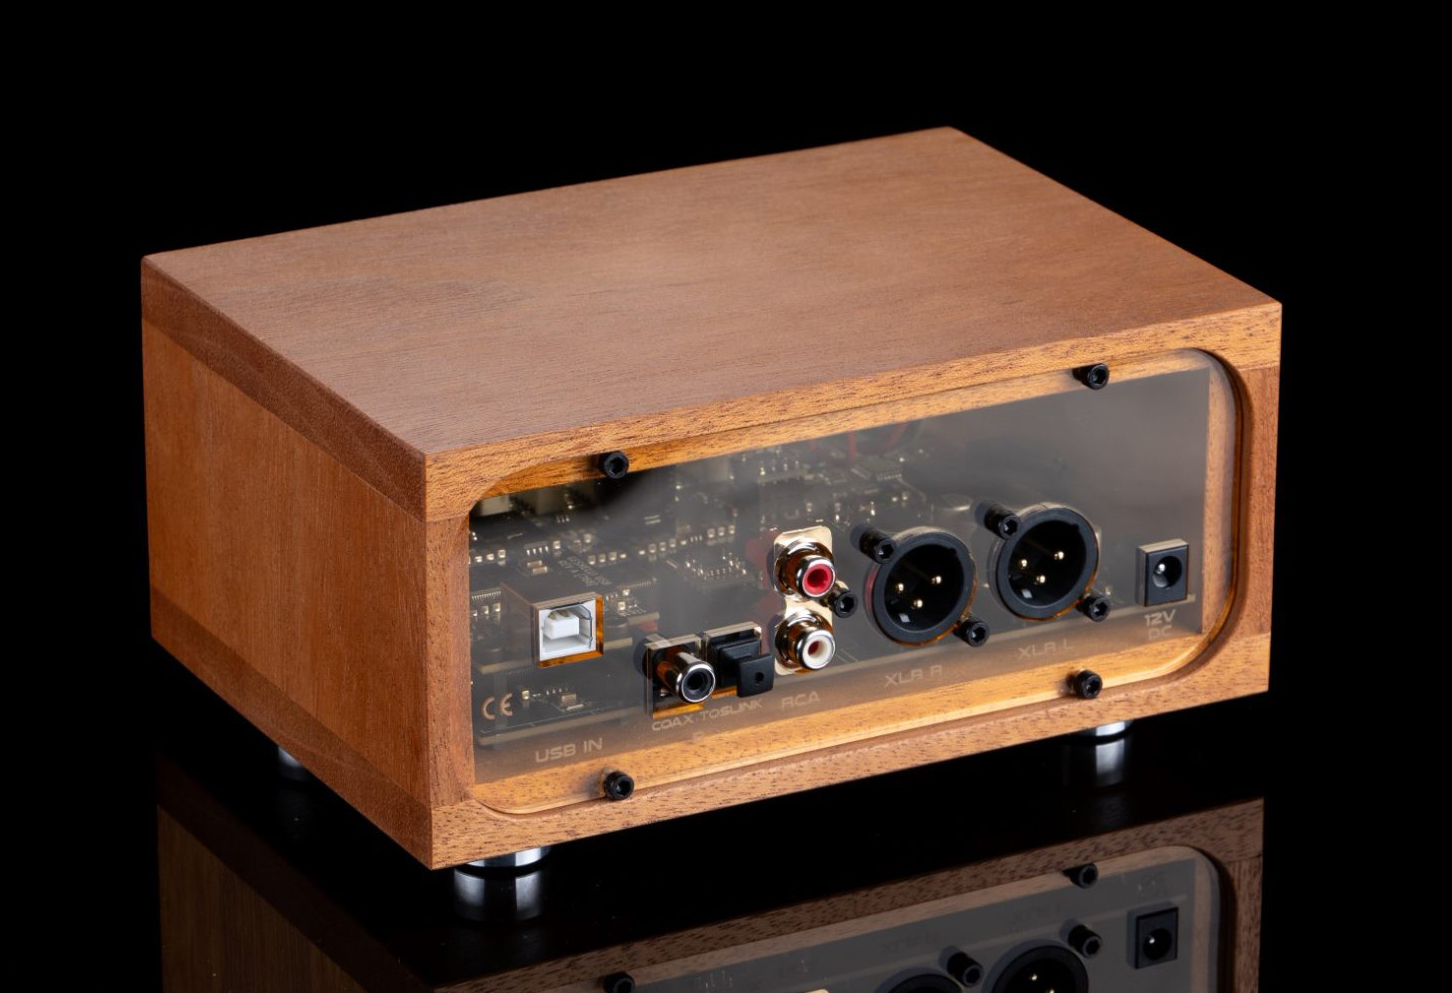
Most audio products come with lots of features. To say the J3 Pro is a minimalist design is an understatement. The front panel has six metal push buttons, one for on/off and five to select inputs (Toslink 1, Toslink 2, Coax 1, Coax 2, USB). One Toslink and one Coax are on the front, and the other three inputs are on the rear panel. Dual XLR balanced outputs and a pair of RCA analog inputs are also there. A 12V wall-wart DC power socket is on the far right. The review sample’s enclosure is made of expertly worked and finished solid wood (Geshelli Labs offers several wood finish options as well as more contemporary aluminum case choices), and the front is clear plastic so you can see the PC board on the inside. It’s very stylish in my opinion, and my wife really liked the looks too.
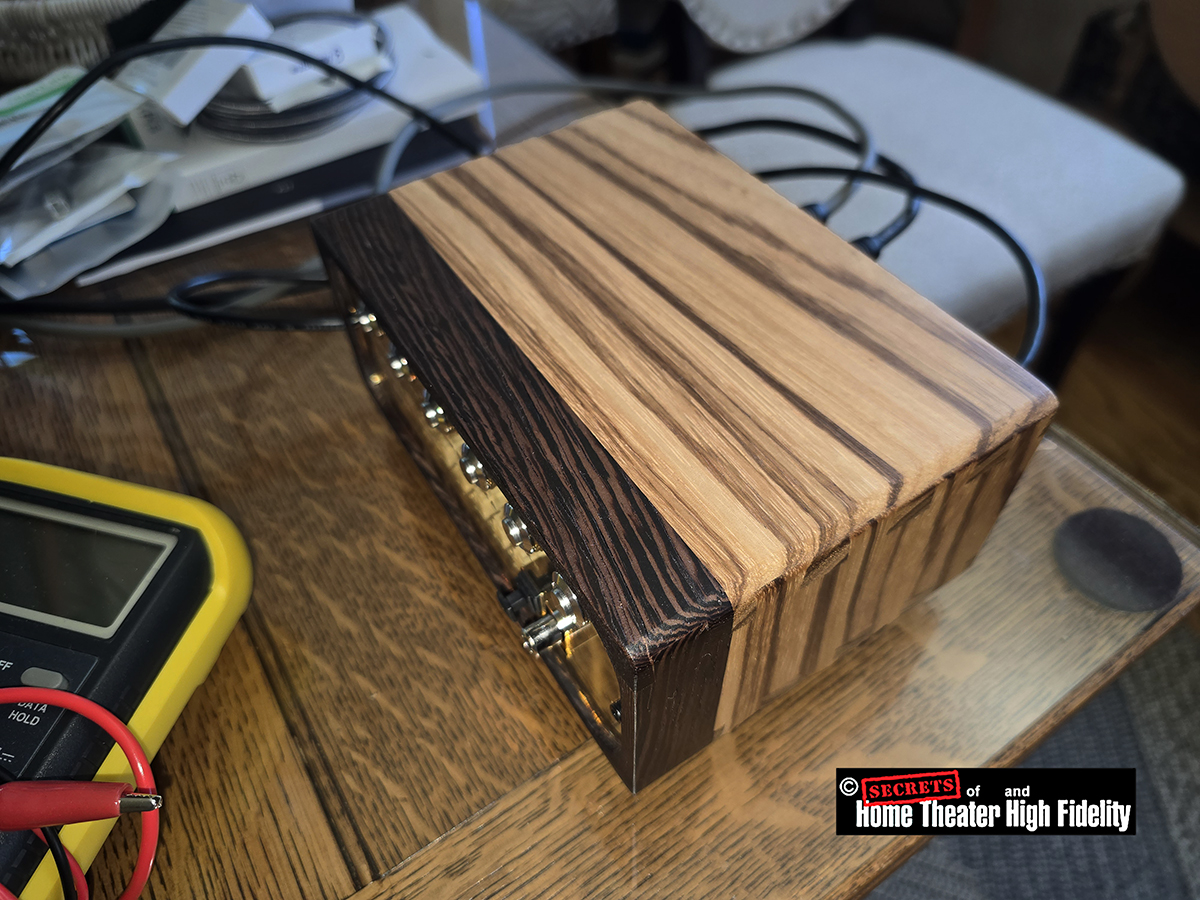
The review unit had oak tongue-in-groove panels. Very nice! It is great to see audio products with fine woodwork enclosures again.
I used the JNOG3 DAC with my MacBook Pro M4 MAX laptop connected via USB-C to the USB-B input on the rear panel, outputting from Qobuz streaming. The analog outputs from the J3 were connected to my OPPO HA-1 Headphone Amplifier and a pair of OPPO PM-1 Planar-magnetic Headphones.
Here is a montage of my go-to albums:
My best go-to favorites like Art Pepper, Himmelrand, and Anne Akiko Meyers sounded the way I like them: smooth and non-edgy. In fact, that is the way I classify the sound of the Geshelli JNOG3 DAC: a little laid back and really quite nice.

Sir Andrew Davis, BBC Philharmonic Orchestra, Martyn Brabbins, “King of Kings – J.S. Bach Orchestral Transcriptions”
J.S. Bach is a name everyone knows. His Toccata & Fugue in D Minor for pipe organ is a composition that everyone has heard somewhere. In this album, Bach’s piece has been arranged for orchestra by Sir Andrew Davis. It is very interesting how the various instruments in an orchestra can be used to simulate the sounds of the various organ pipes. Such is the case for the opening, where deep bass is re-created by the trombone section. This is not easy to do, but it is accomplished in a brilliant manner in the album, and the JNOG3 did it full justice.
Lee Morgan, “Here’s Lee Morgan”
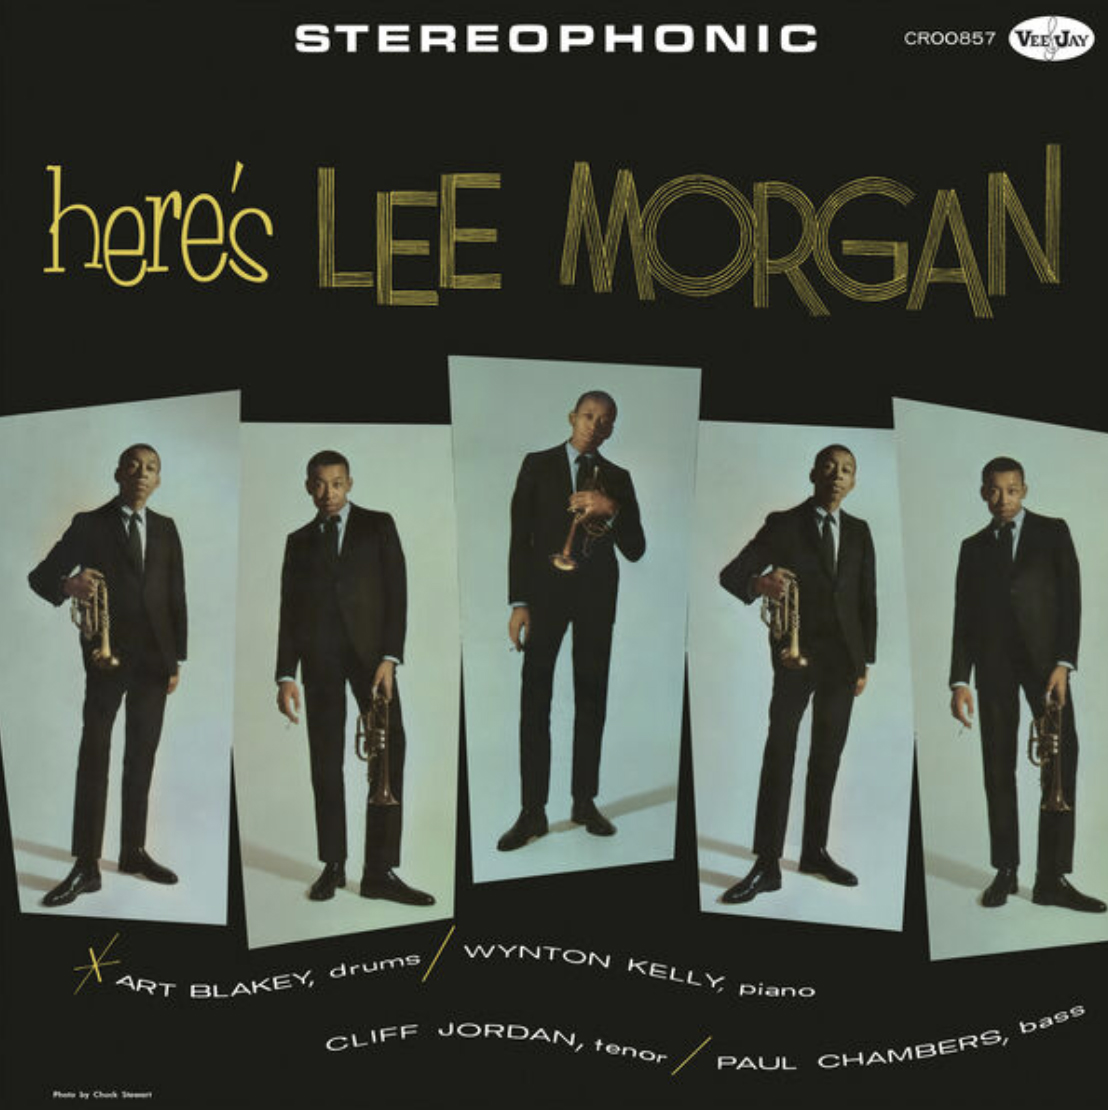
Lee Morgan was a classic jazz trumpeter, and in those days (1960 for this album), jazz masters played in each other’s jazz groups. Every musician here had an established reputation, such as Art Blakey (drums), Wynton Kelly (piano), and Paul Chambers (bass). Although this album is more than 60 years old, it was remastered beautifully. Of course, it does not sound like a modern recording, but it is amazing for that age. The JNOG3 detects and handles those fine differences splendidly.

Tom Hicks, “Chopin: The Complete Nocturnes”
As I’ve said many times, the piano is especially difficult to reproduce because so many notes can be played at the same time on one instrument. This Chopin album is no different, and the JNOG3 played all those notes smoothly and with depth. It’s a very relaxing album by the way (Nocturnes tend to be that way), and I recommend listening to it during evenings when you are feeling stressed out. I used it one night myself with the JNOG3 and the OPPO Headphones.
J.S. Bach, Gustav Leonhardt, “Suite BWV 996, Toccata BWV 914, Capriccio BWV 992, Fantasia & Fugue BWV 904, Prelude, Allegro, & Fugue BWV 998”
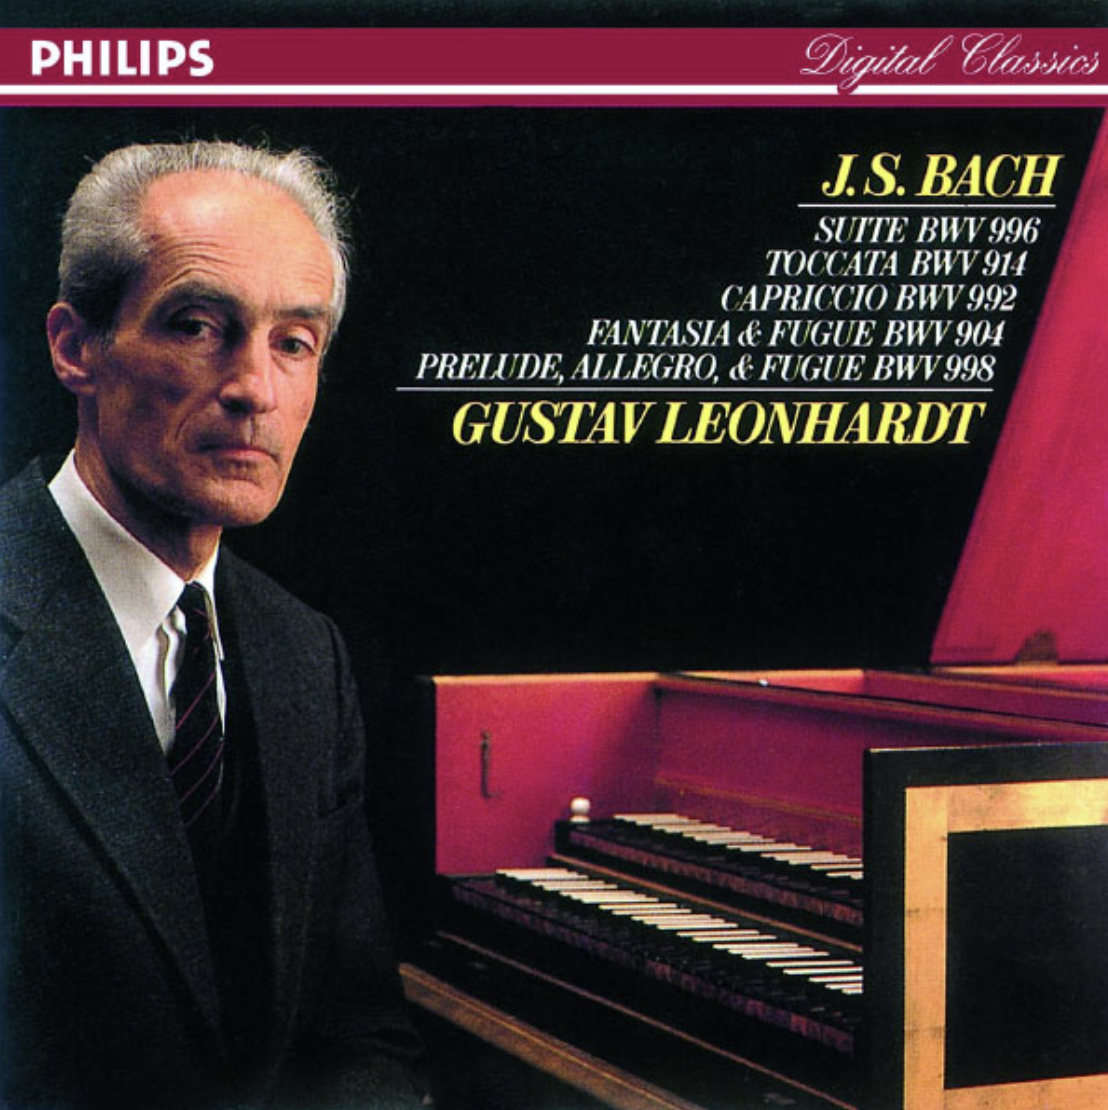
Now, the Harpsichord, on the other hand, tends not to be a relaxing instrument to listen to because of its “twangy metallic” nature. The strings are plucked instead of being struck with a felt hammer in the case of the piano. Any component in the signal path that has significant distortion would emphasize this sound. The JNOG3 did not do that, keeping every note under control and sounding pleasant.

ZZ Ward, “Liberation”
ZZ Ward is a popular country singer. Here, with her magical guitar, she presents a very unique personality. The distortion from her electric guitar is something that many artists employ in their presentations. I wanted to see if the Geshelli Labs JNOG3 made it sound harsh, and I was pleased that it did not.
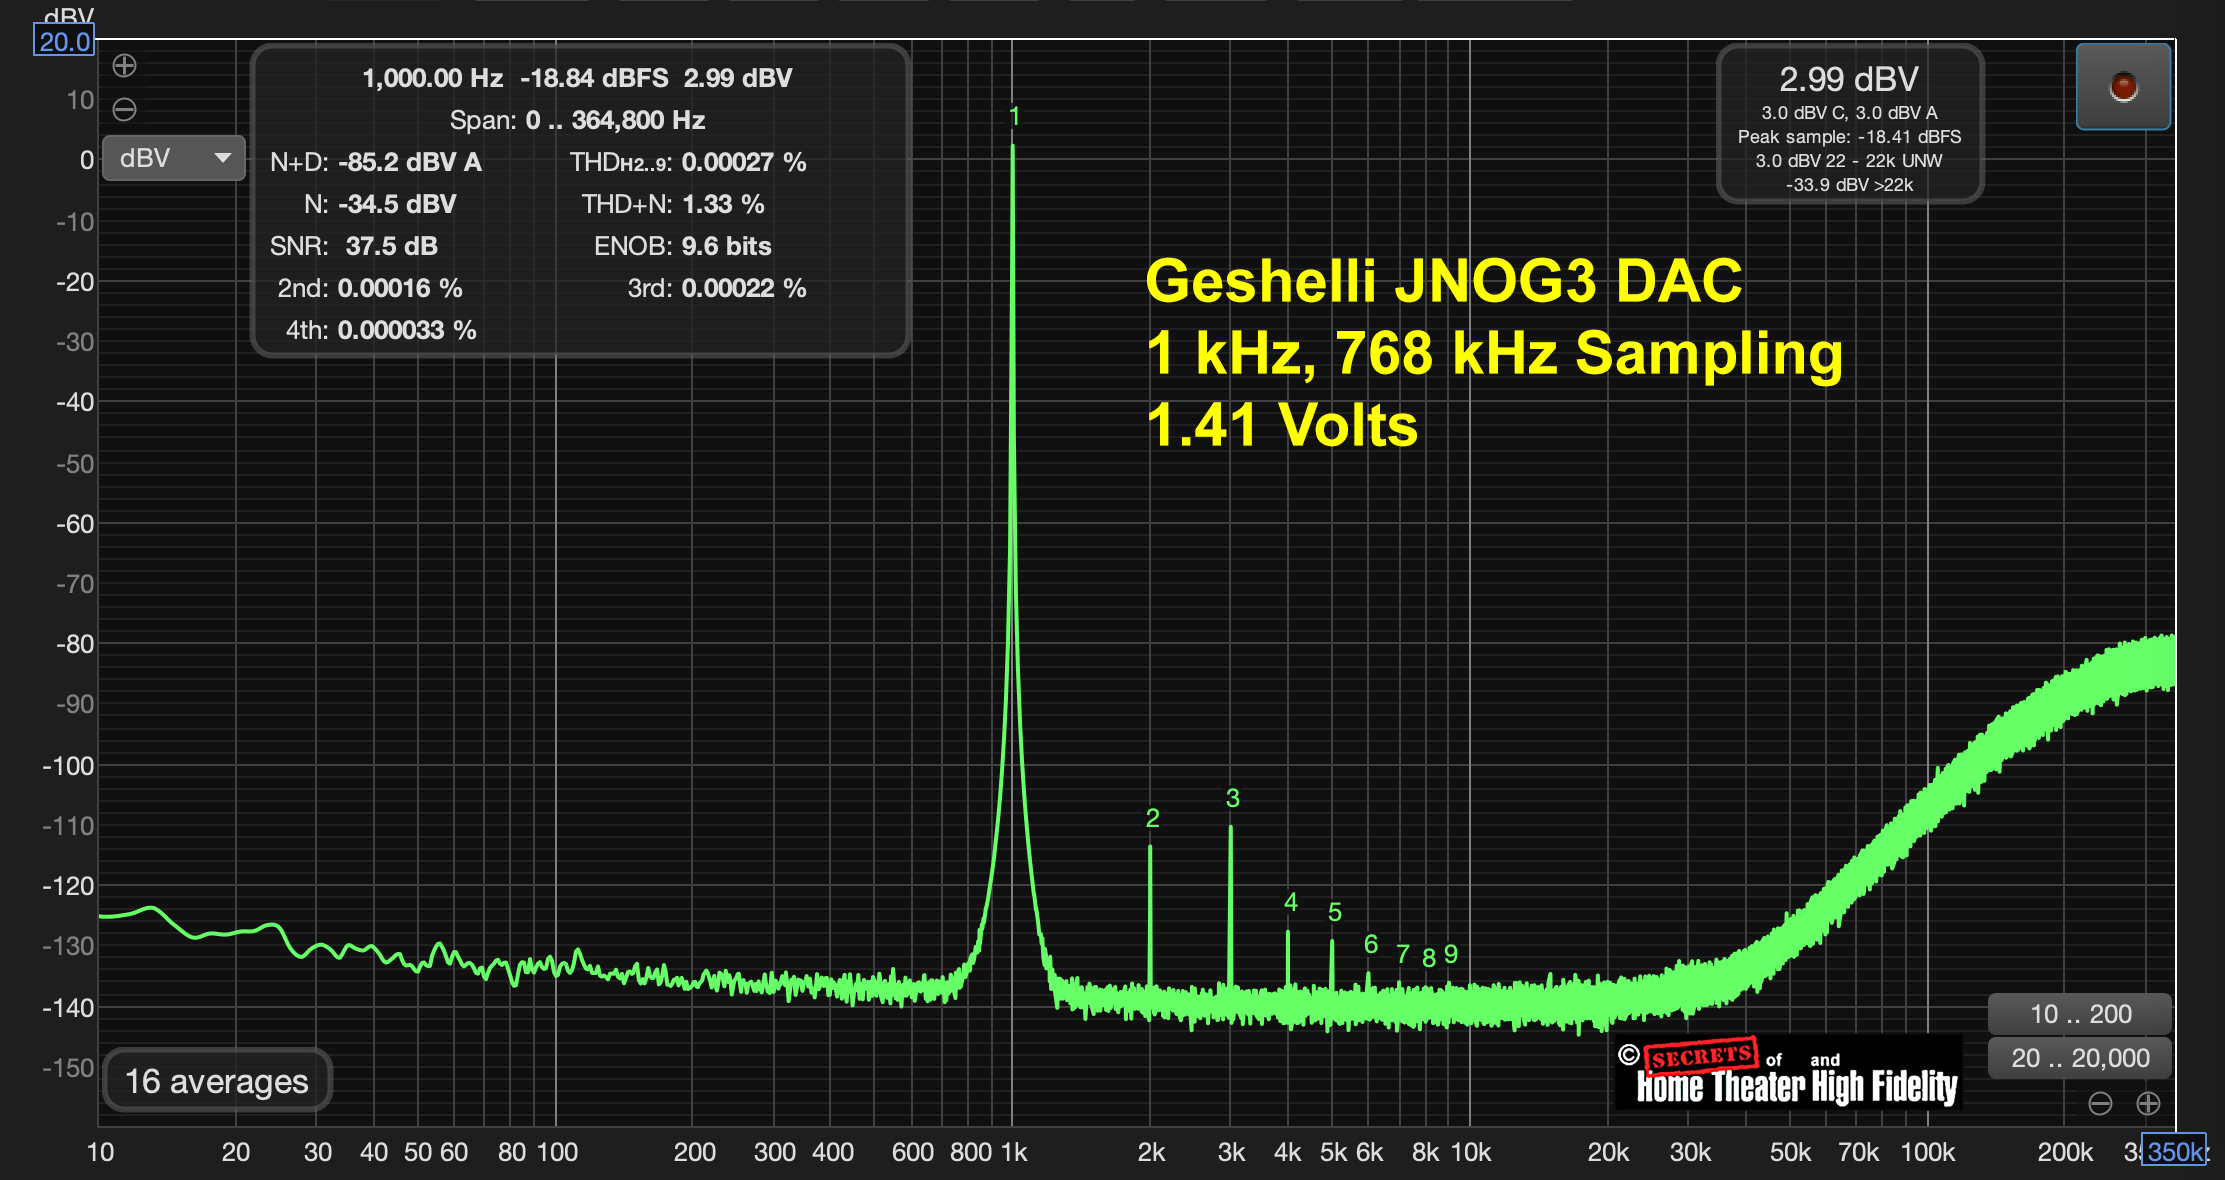
I used the USB-B input on the JNOG3 because coax does not accept anything over 192 kHz sampling. A 1 kHz sine wave at 768 kHz sampling confirms the JNOG3’s high-resolution capability. THD was at 0.00027% using -6 dBFS as the input level. Output was 1.41 Volts. THD+N is much higher at 1.33% because of the noise shaping band above 20 kHz. The 2nd-ordered harmonic and 3rd-ordered harmonic are nearly the same height, with the 3rd being just a bit higher. Note how low the noise floor is in the audible band. This is probably due to the fact that the Geshelli JNOG3 DAC has no Bluetooth or Wi-Fi connectivity, which might otherwise increase the amount of radio-frequency contamination. On the other hand, noise shaping frequencies can intermodulate with audio band frequencies, but that is a universal issue with all modern DACs, which are almost entirely Delta-Sigma in design.
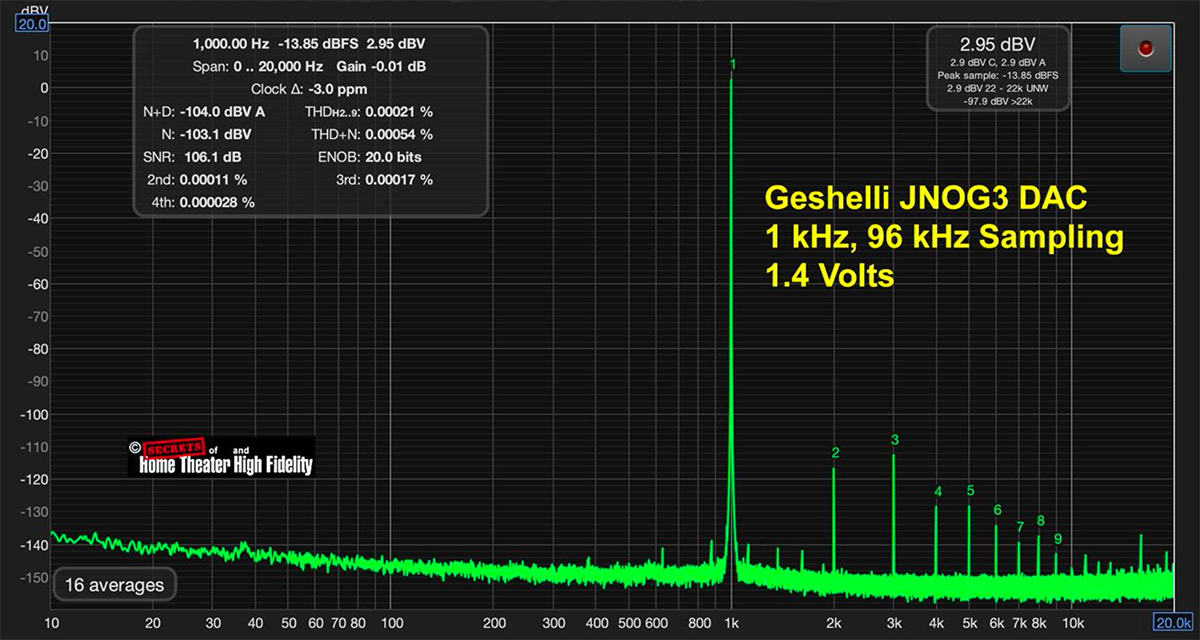
With a 1 kHz sine wave at 96 kHz sampling (figure below), 1.4 Volts output, the same distortion peaks are there, but the noise floor is lower. One of the purposes of this test is to measure the ENOB (Effective Number of Bits), which, for this case, is 20 bits (you can see this on the second-from-the-bottom line on the right-hand column in the distortion panel on the upper left side of the spectrum). That is about the limit for DACs of all types, even though the recording may be 24-bit or 32-bit. The ENOB is a reflection of the noise floor, which, in turn, is a reflection of the limits of the analog output stage and a few other things.
The formula for calculating the ENOB is (SNRdB – 1.76) / 6.02. For the analog balanced output on a DAC like the JNOG3, the SNR (Signal-to-Noise Ratio) might be 125 dB, so (125 – 1.76) / 6.02 = 20.4 bits.
Even though the DAC might accept 32-bit, 768 kHz sampling, its analog output is limited by the analog output circuitry in the DAC chip and the analog op-amp.
Also:
| ENOB Limiting Factor | How It Affects ENOB |
| Thermal noise (resistors, op-amps) | Adds a baseline noise floor |
| Reference voltage noise | Fluctuates output scaling |
| Power supply ripple | Introduces modulation artifacts |
| Output op-amp distortion | Adds THD, reducing dynamic range |
| Layout/crosstalk/jitter | Adds non-linear noise |
| Quantization error | Fundamental but well-modeled |
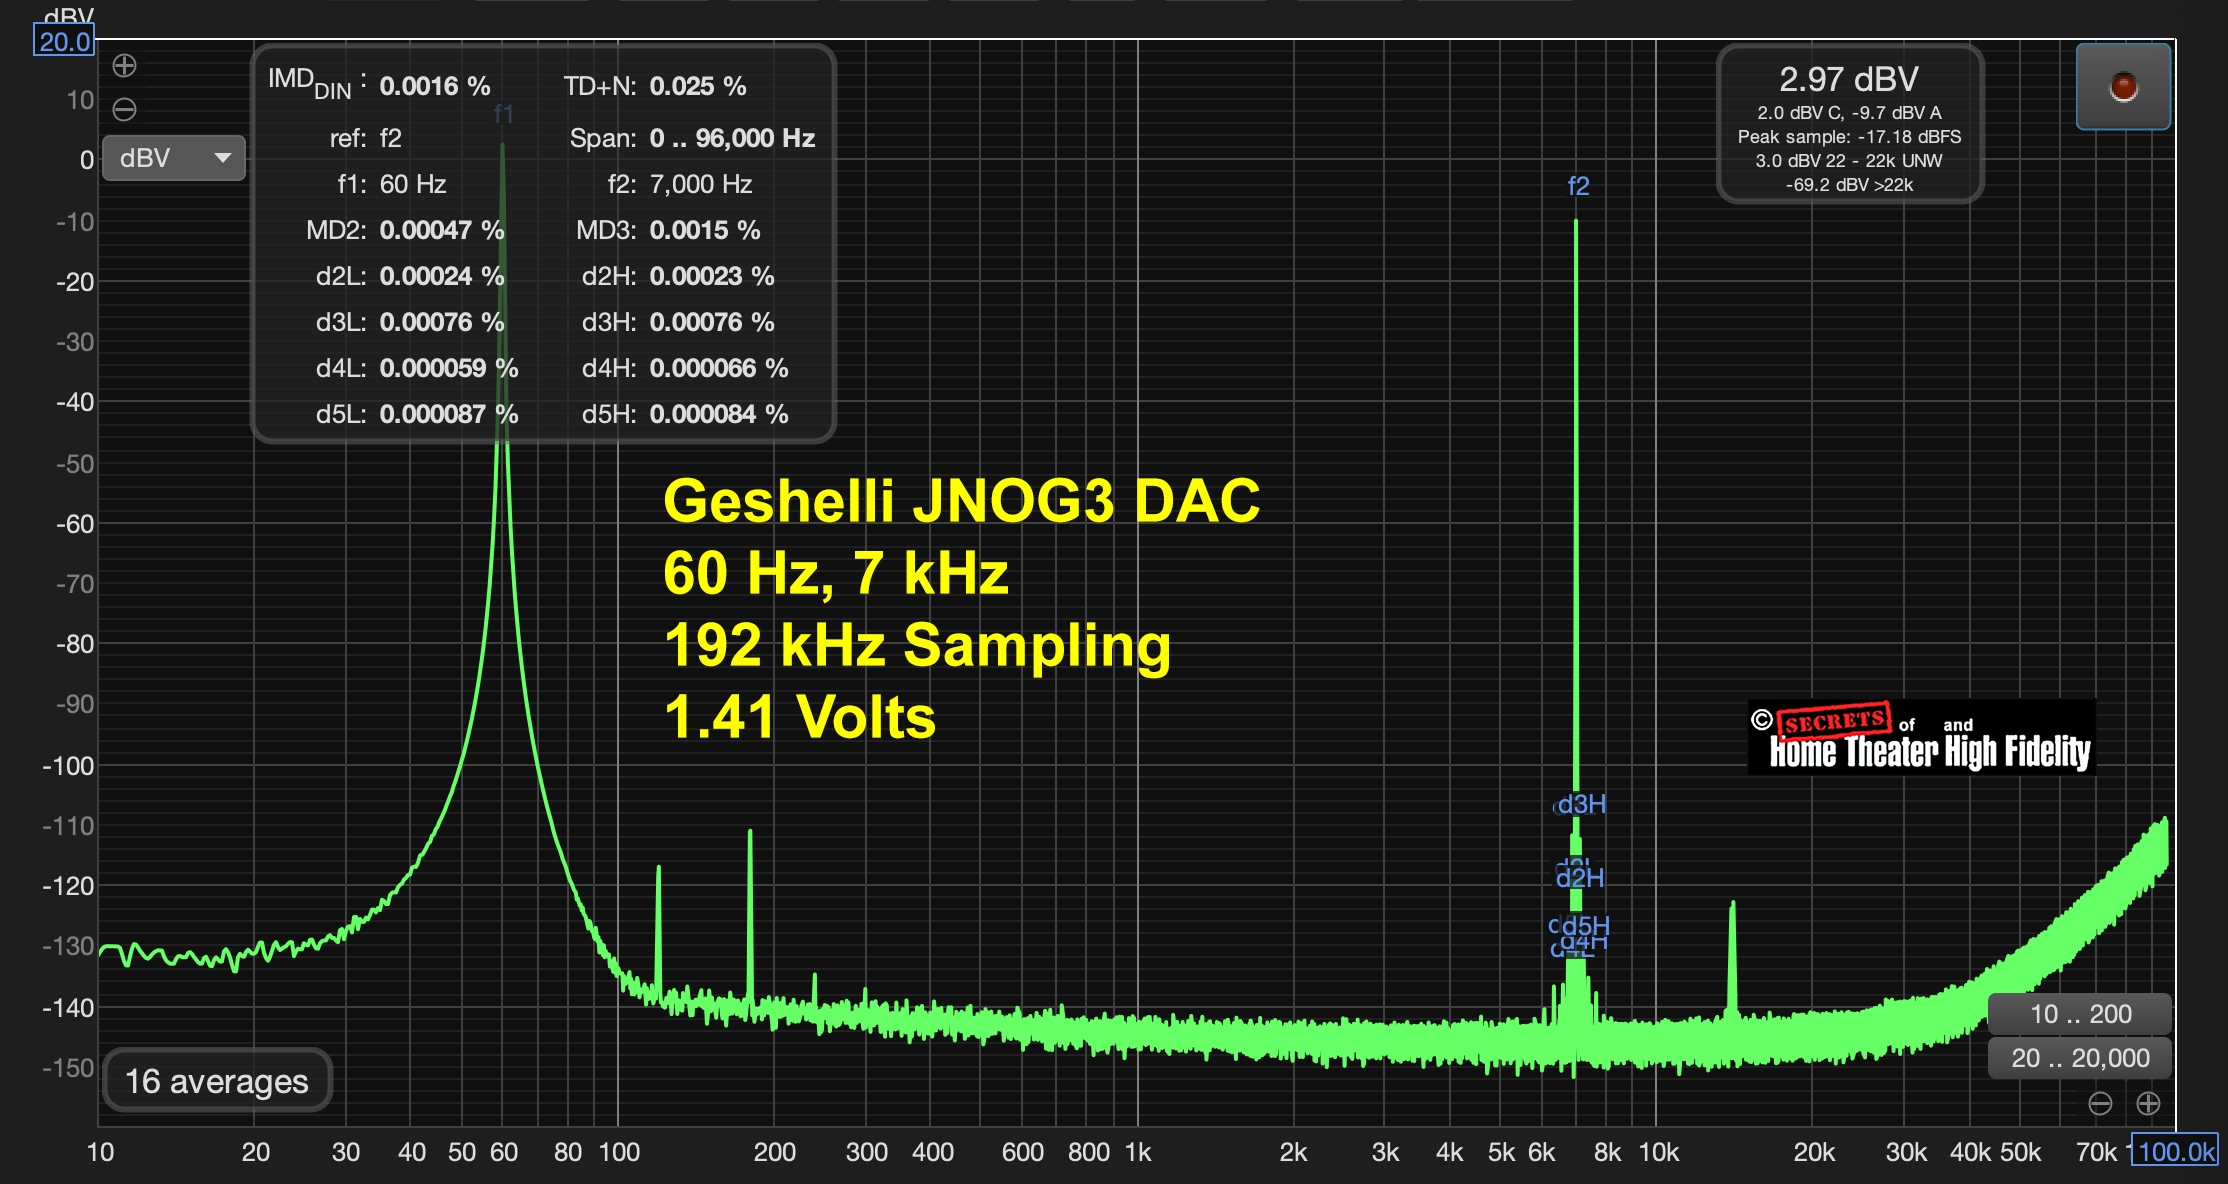
The 60 Hz, 70 kHz IMD test is shown below with 192 kHz sampling. Output was 1.41 Volts. IMD measured at 0.0016%, which is excellent.
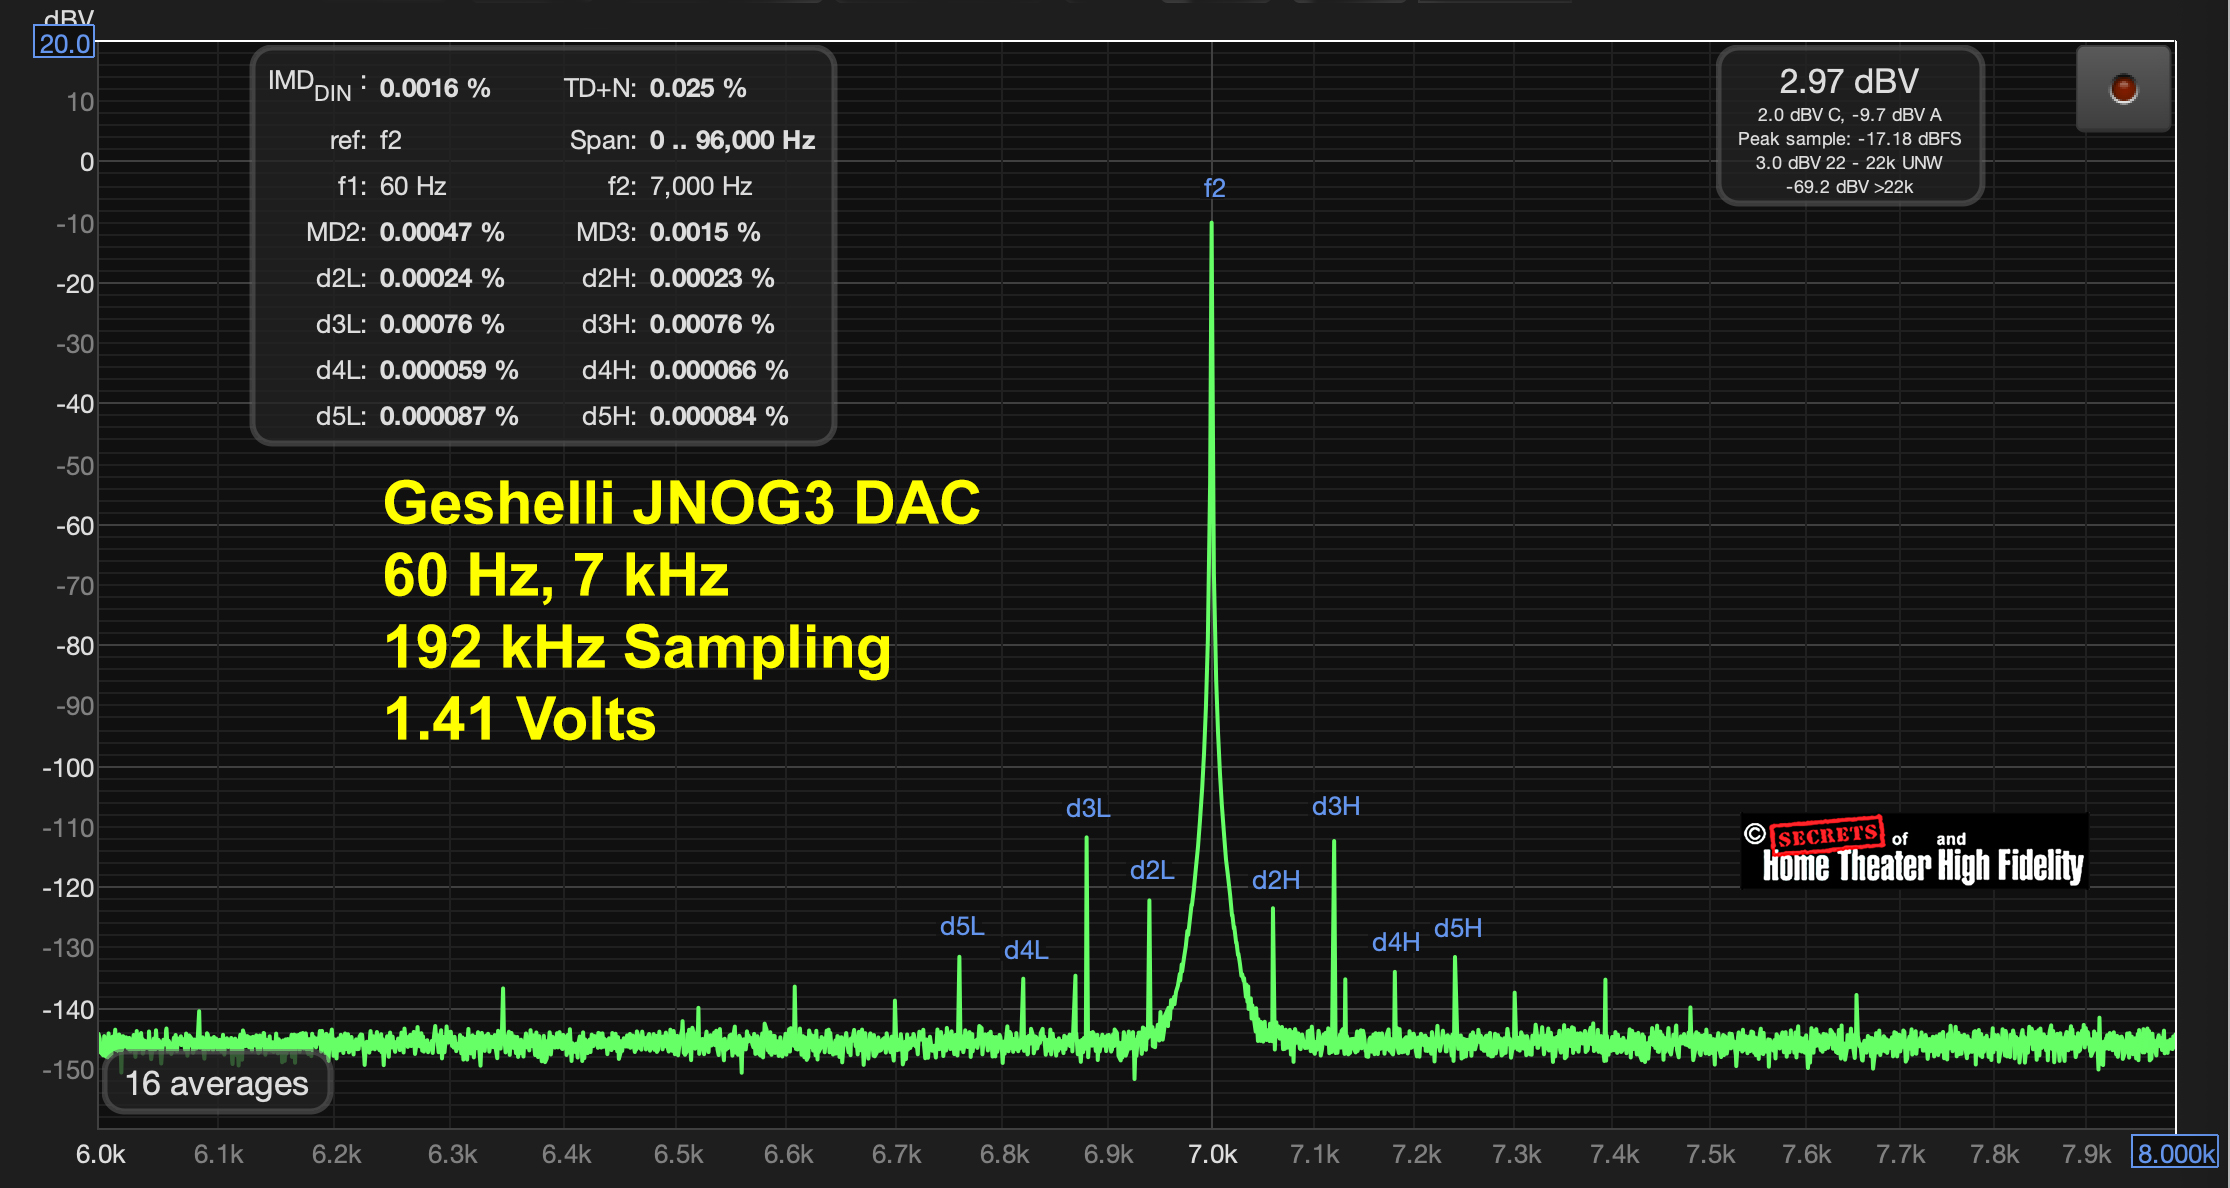
The figure below is the same IMD test with an expanded X axis. The side peaks are all below -115 dB.
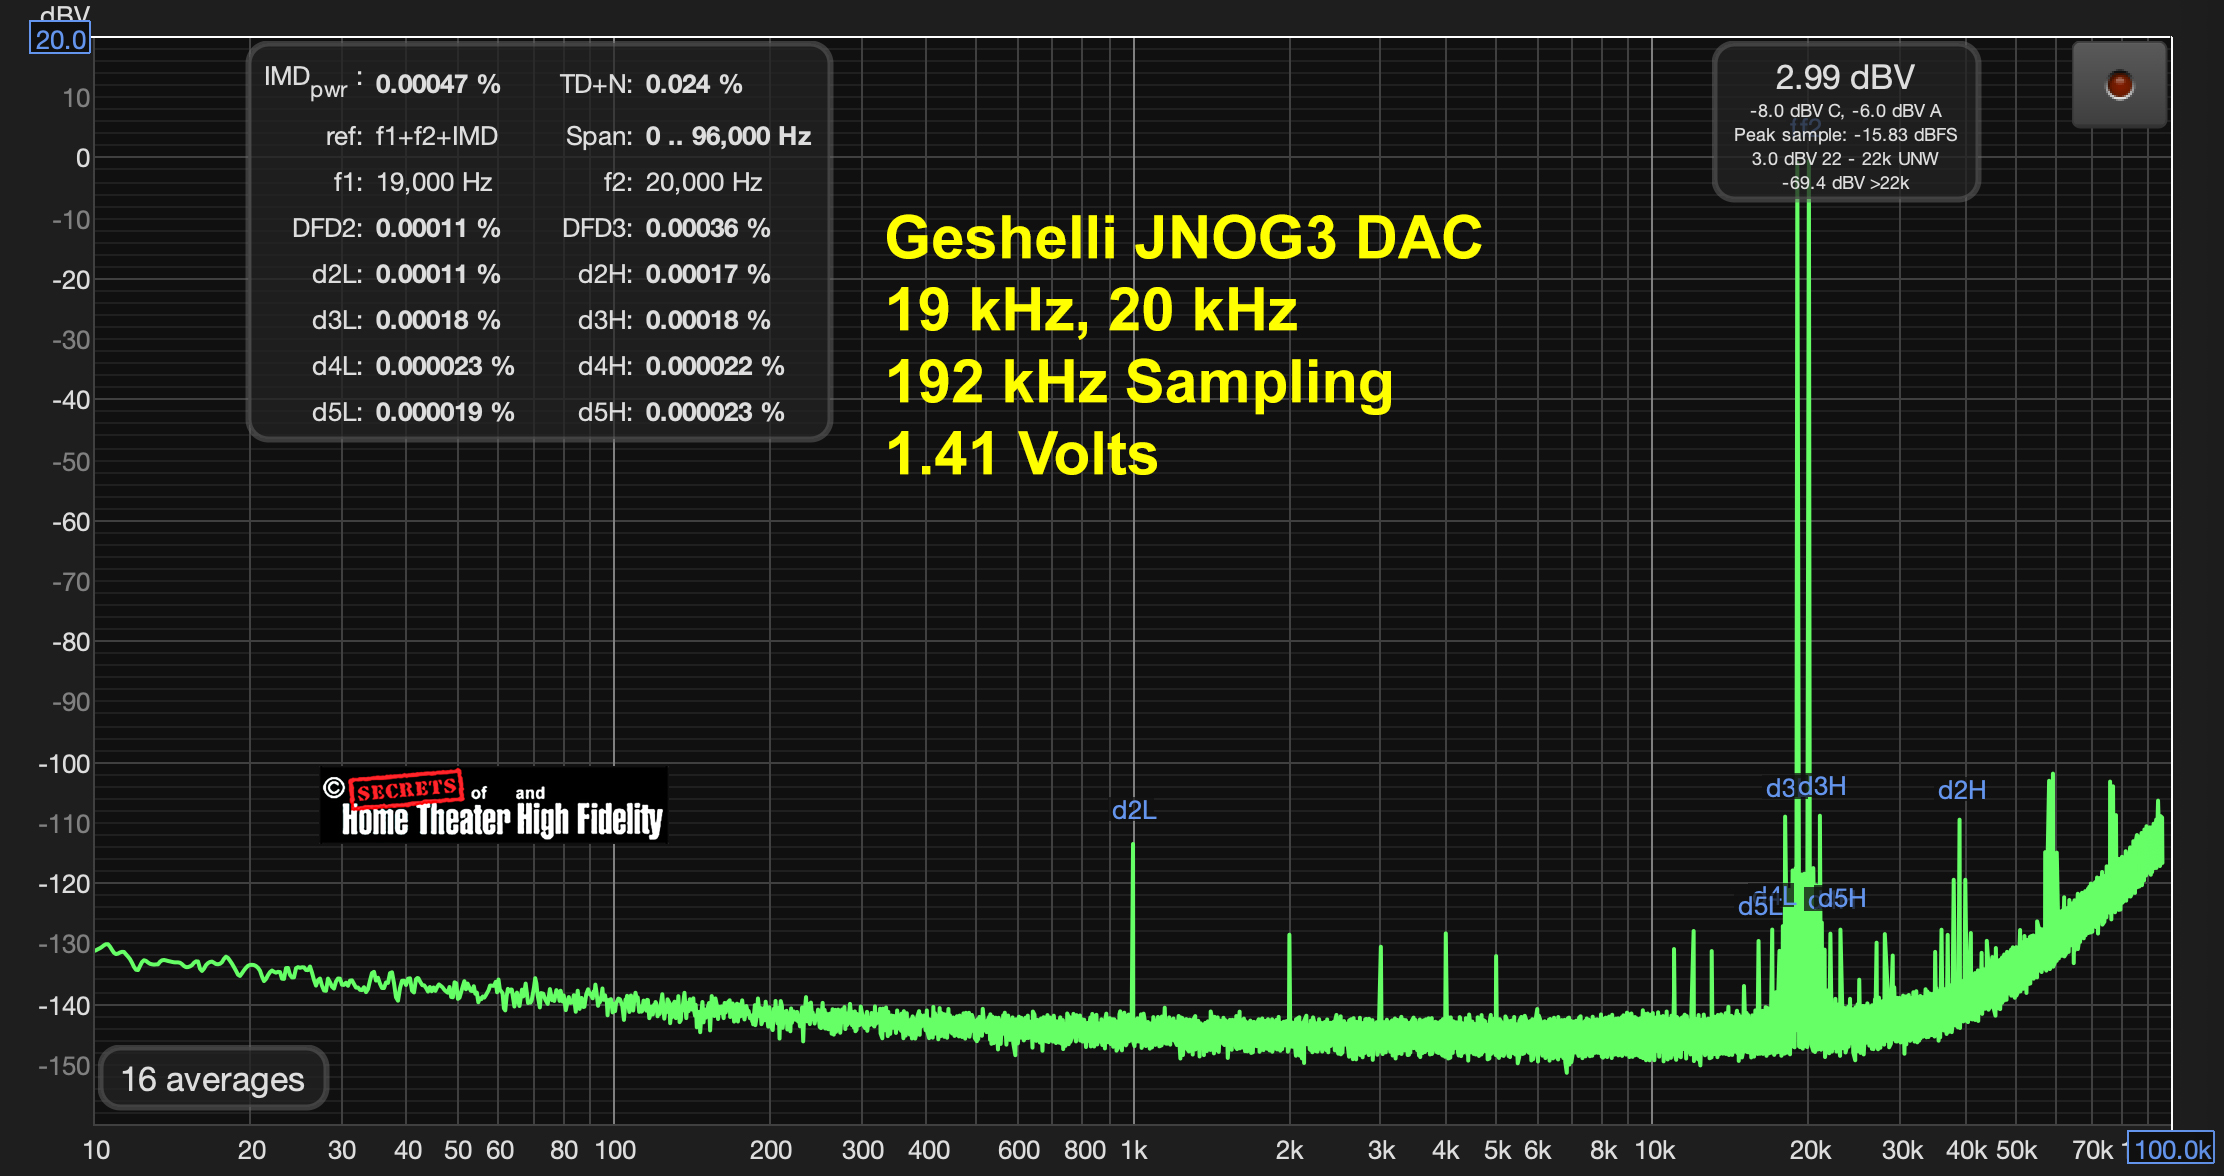
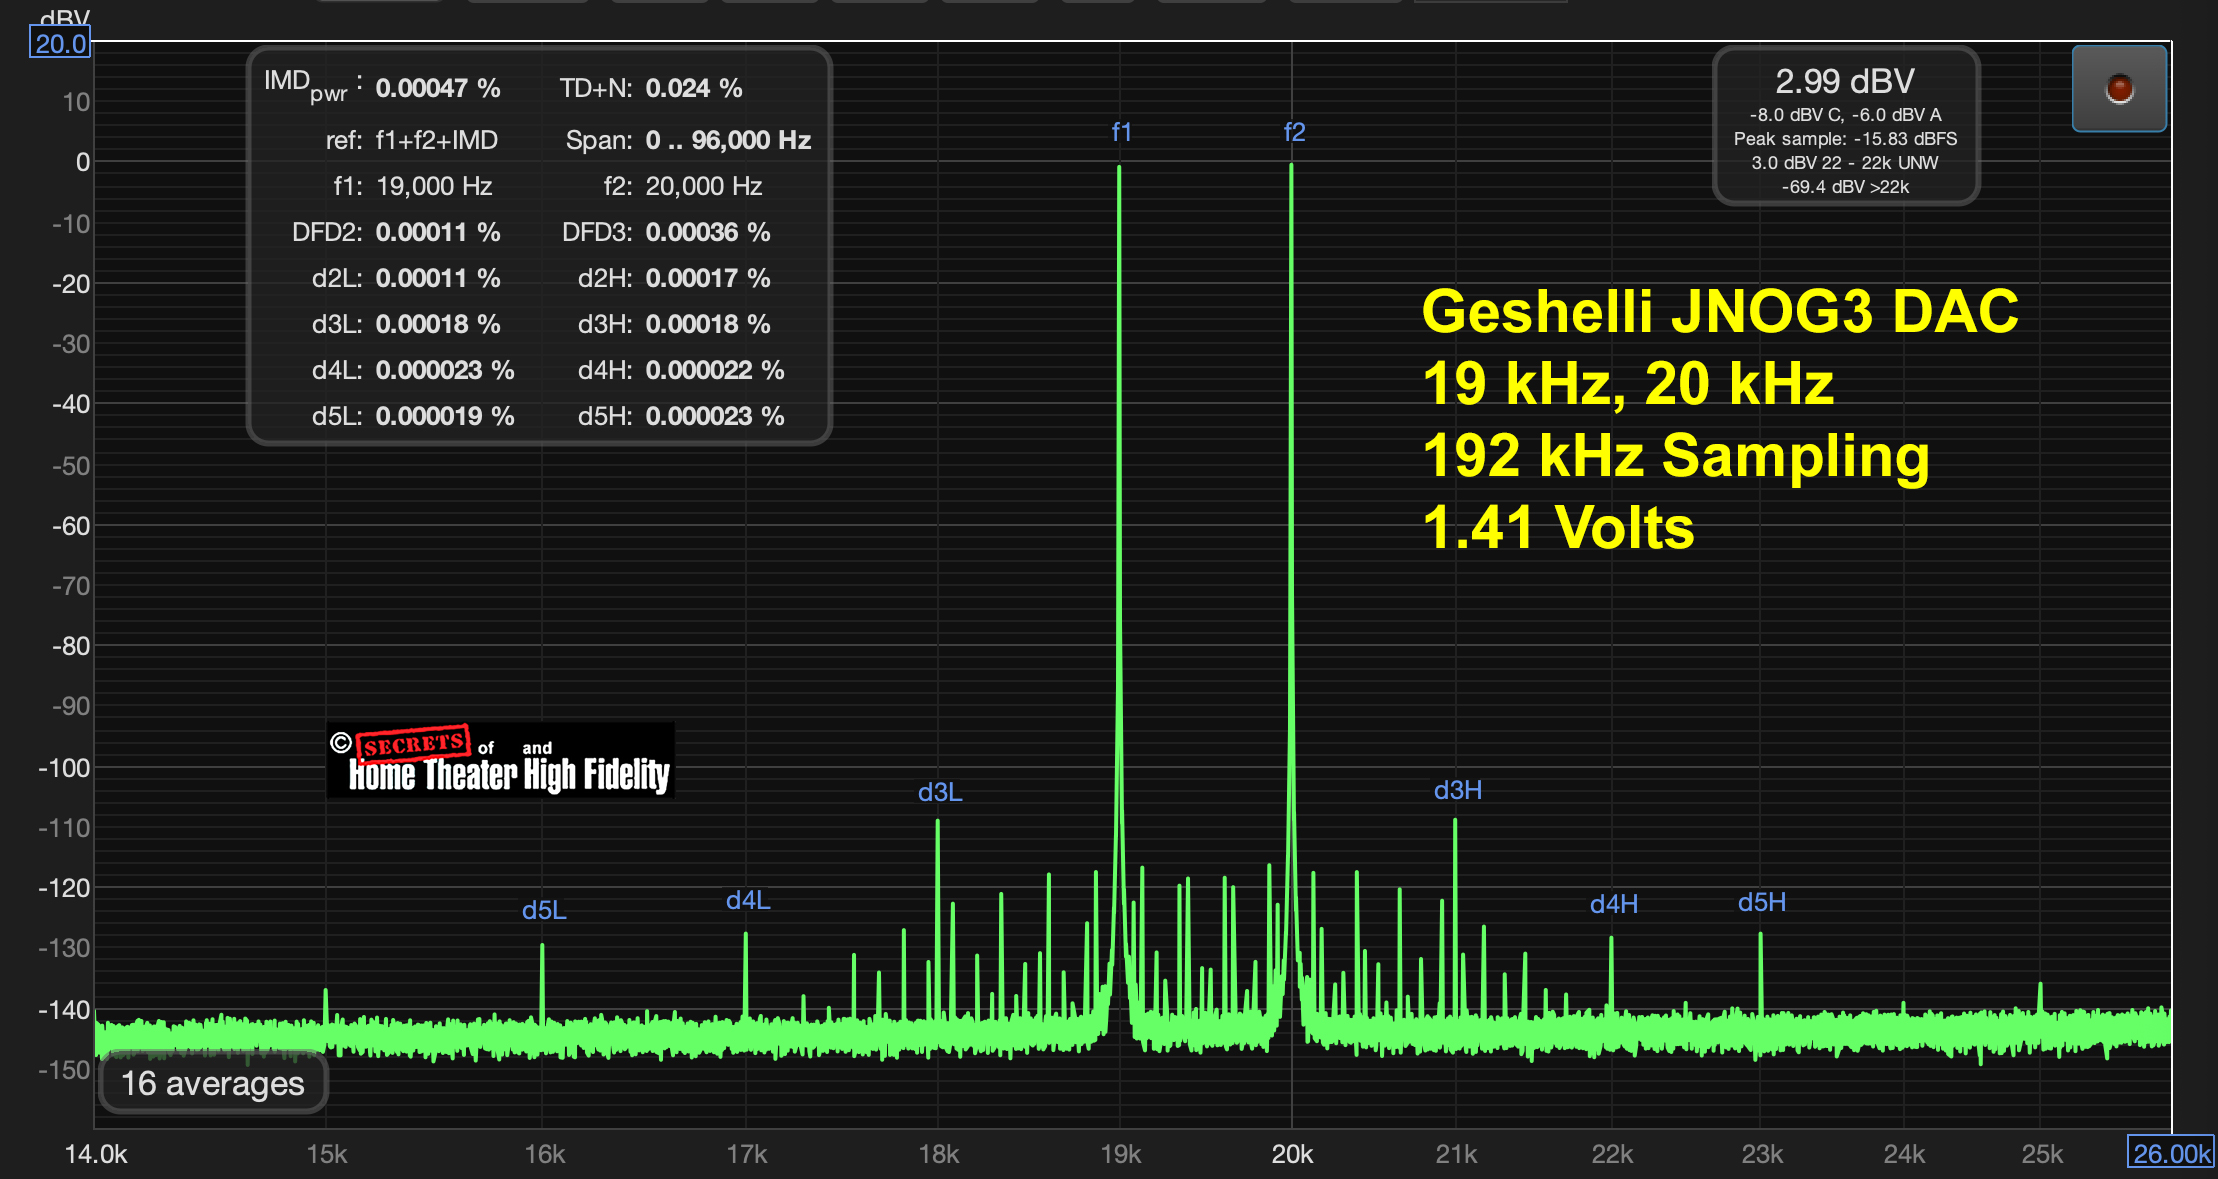
The 19 kHz, 20 kHz test (shown below) has harmonics near -100 dB in the noise shaping band. The side peaks of the fundamentals are low. The B-A peak at 1 kHz is at -113 dB.
Here is the expanded version.
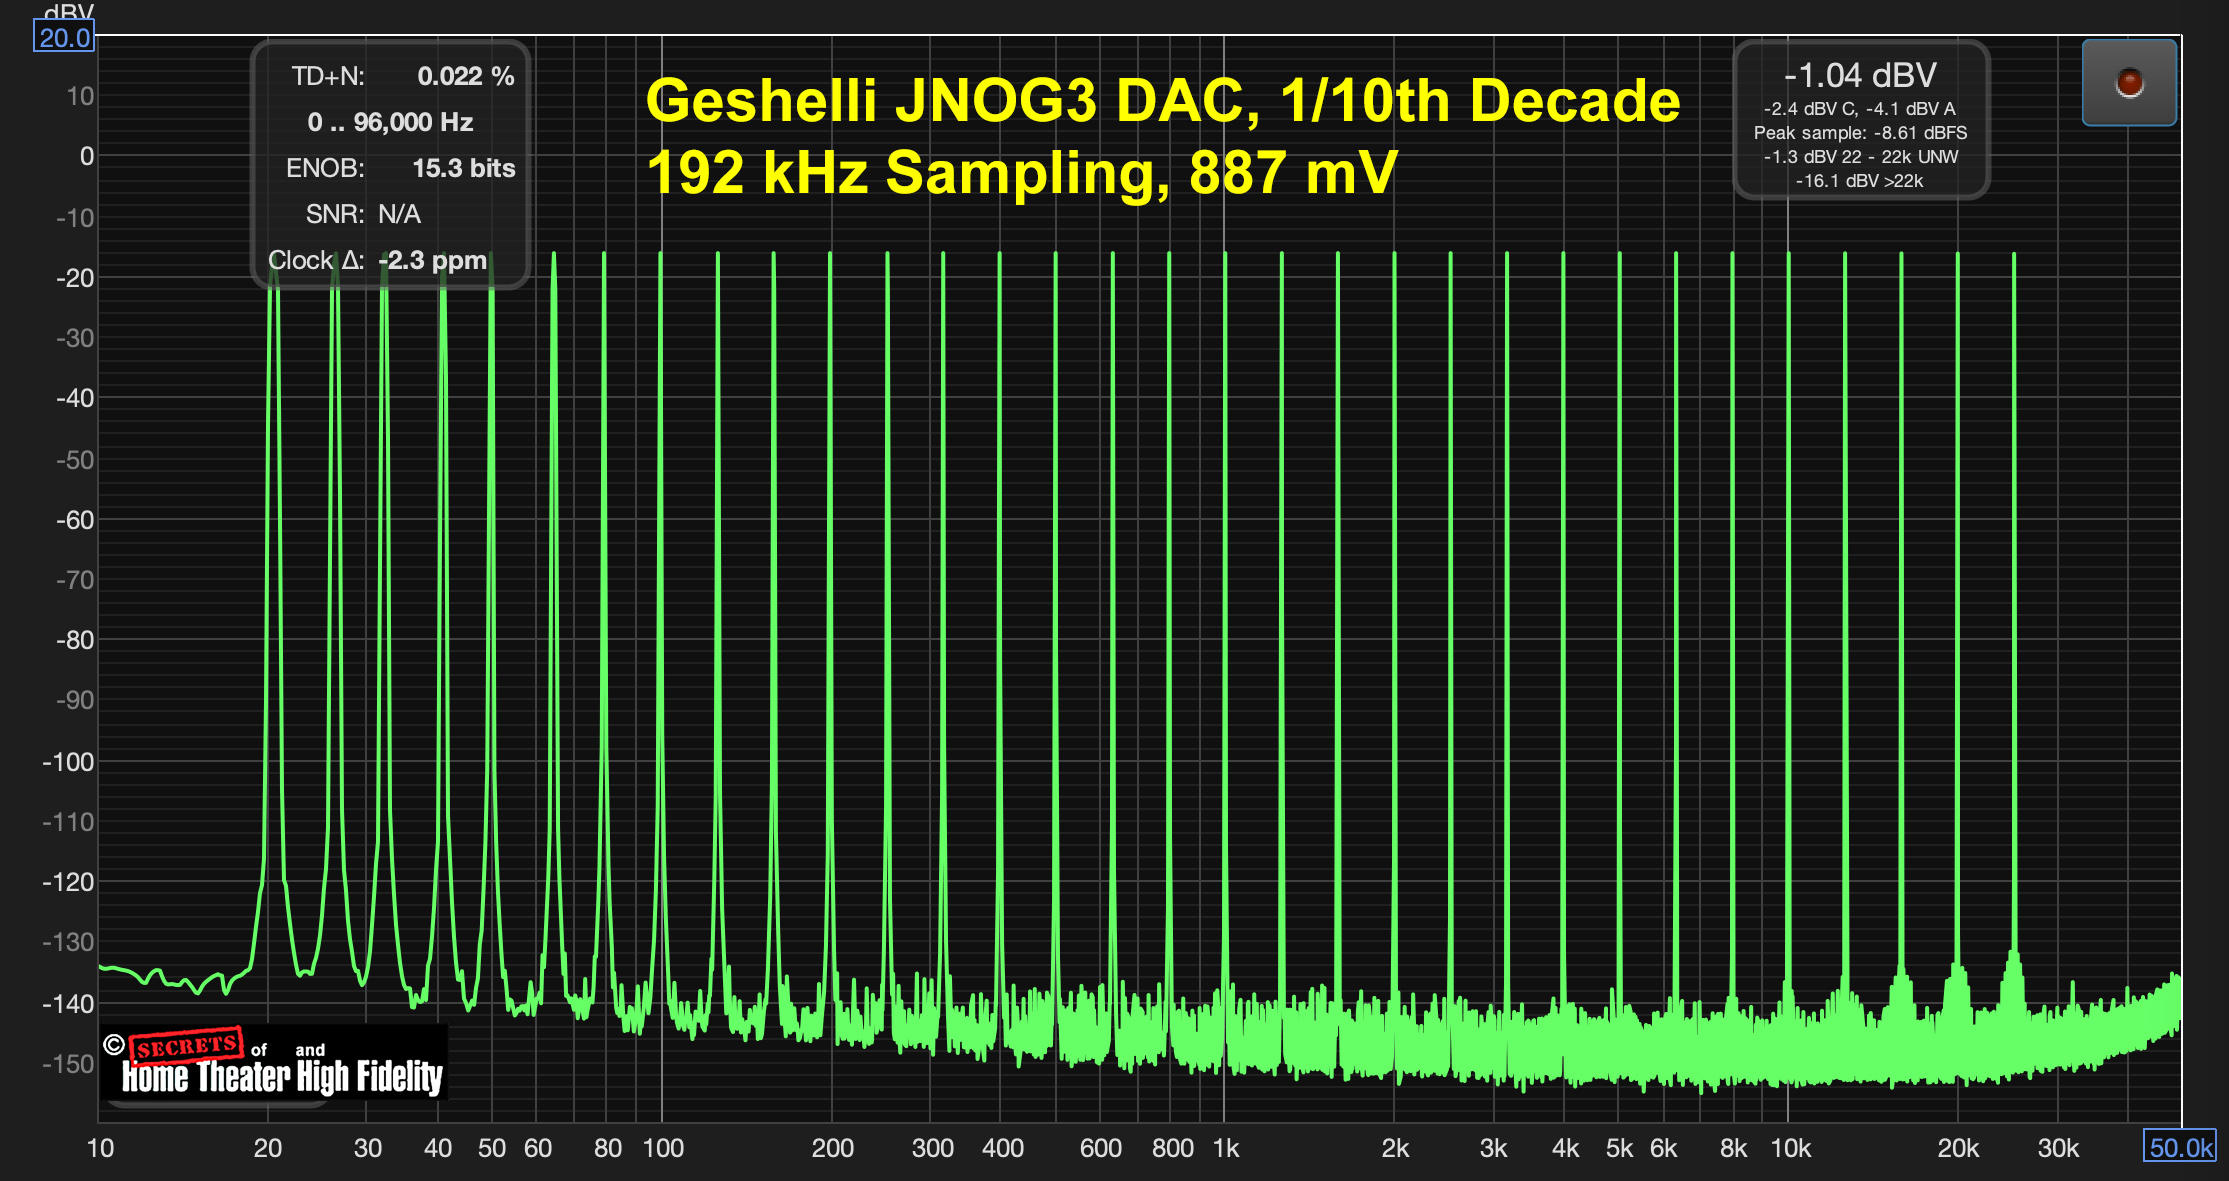
The 1/10th Decade test (below) indicates that distortion concentrates in the midrange region, and there is some intermodulation between 12 kHz and 25 kHz, but it’s all below -130 dB, so it’s inaudible.
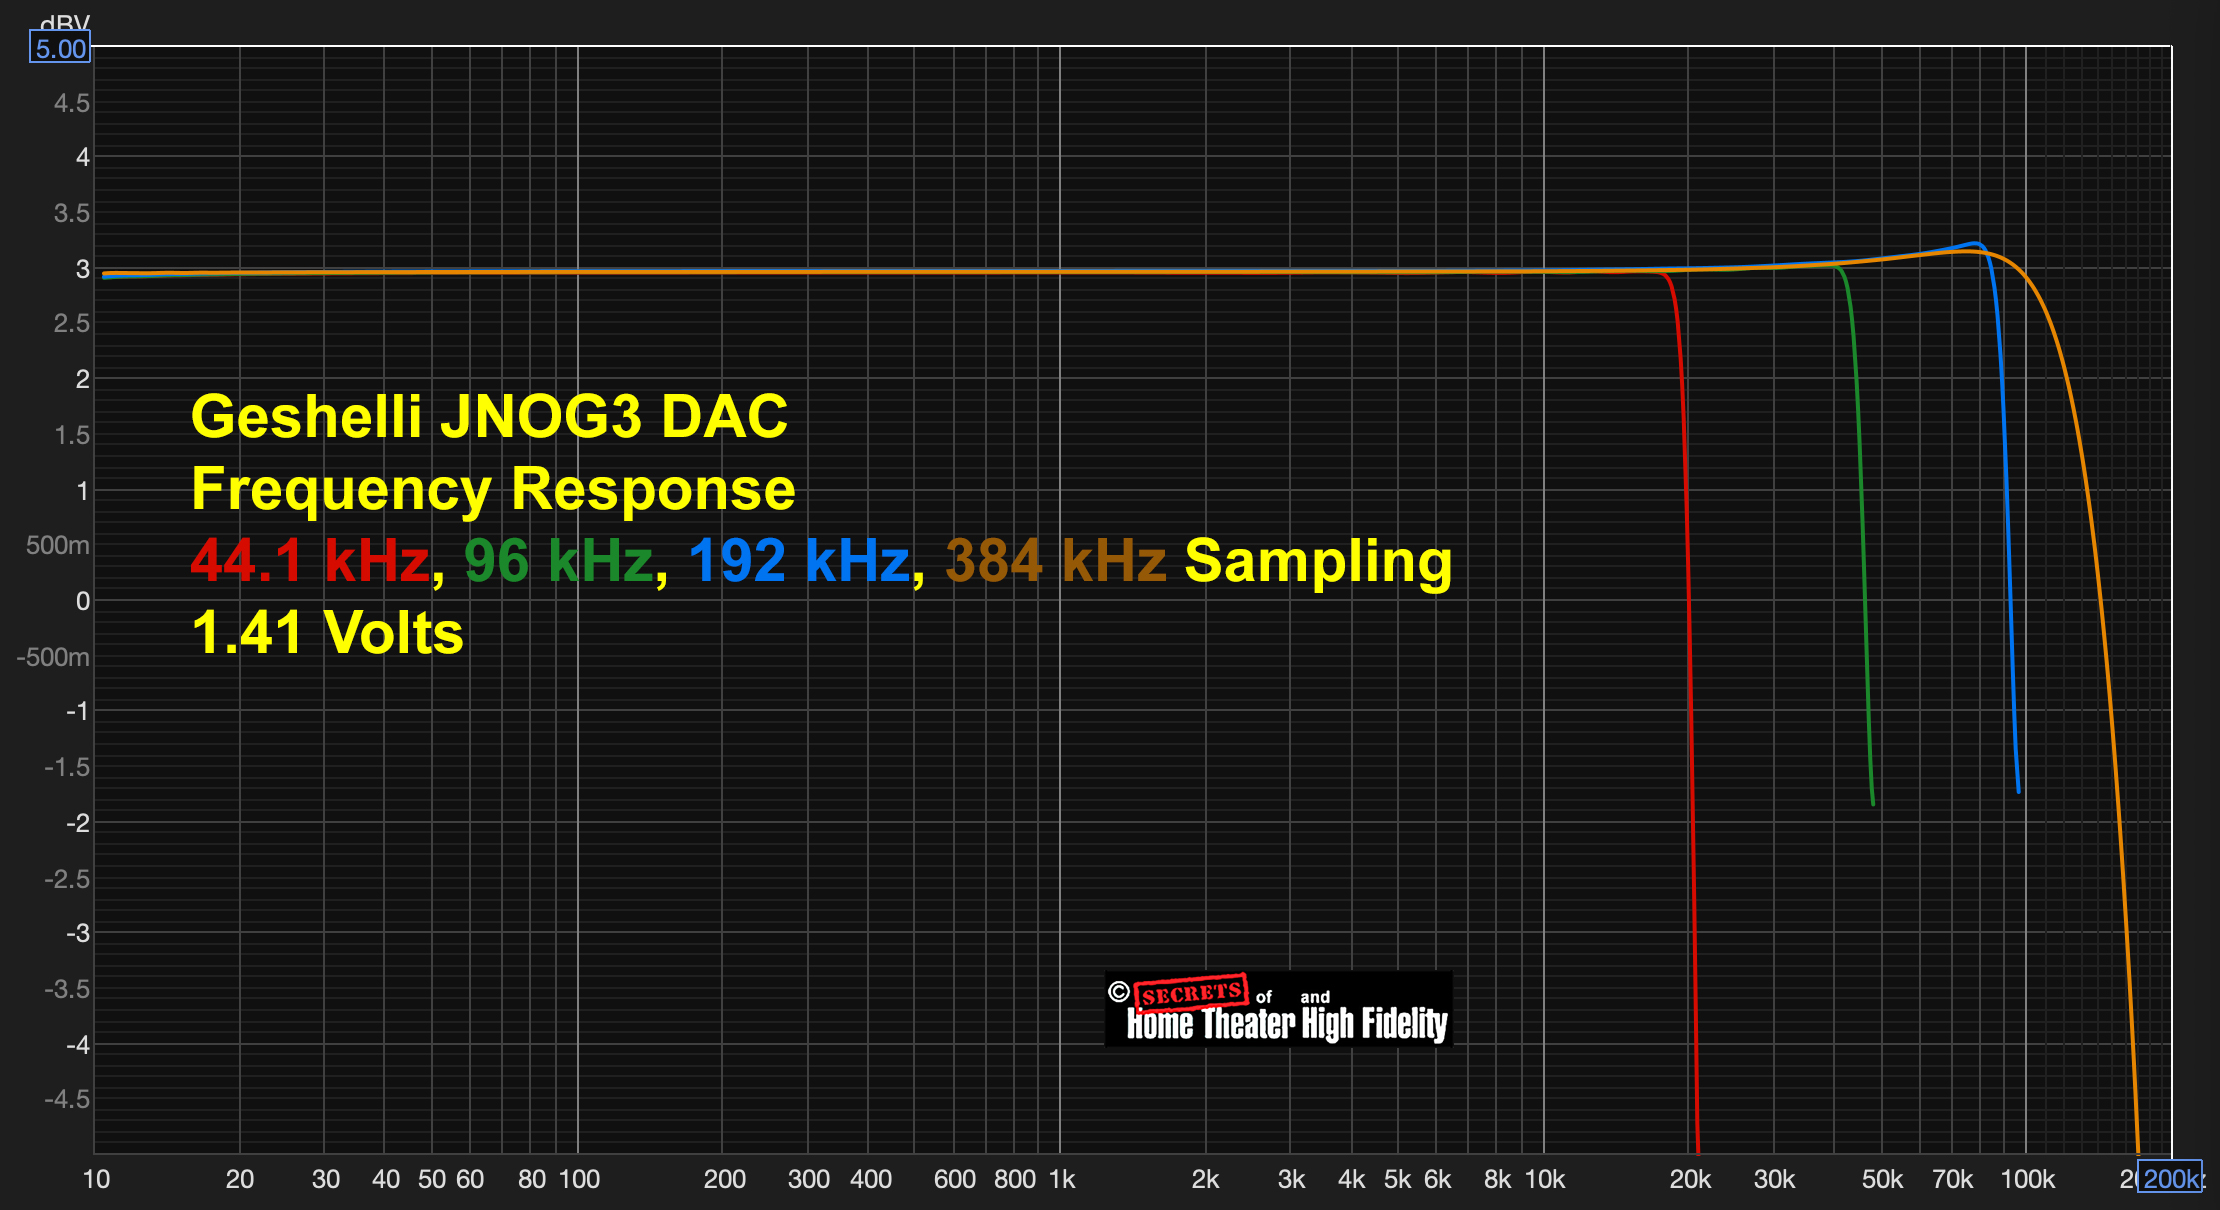
Here is the Frequency Response at 44.1 kHz, 96 kHz, 192 kHz, and 384 kHz sampling:
There is a rise in the frequency response starting at 20 kHz and peaking at about a quarter of a dB at 80 kHz.
That little rise near the high-frequency end of the curve is usually not an accident. It often sneaks in because of the DAC’s digital reconstruction filter design or the output analog stage:
Usual Suspects:
- Filter Ringing & Pre-Emphasis:
Many DACs use oversampling digital filters with a “sharp” or “linear-phase” characteristic. These filters can cause a slight gain rise near the Nyquist frequency (half the sampling rate) to compensate for roll-off earlier in the band. Some engineers think this sounds more “open” or “airy” – audiophiles might agree. - Op-Amp Output Stage Interaction:
If the output stage (op-amp plus RC filter) is not critically damped, you can get a tiny resonant bump. This could be due to the op-amp’s open-loop response interacting with the load capacitance (like cables) or with the reconstruction filter. - Intentional “NOS-like” Filter:
Some DACs purposely add a very gentle high-frequency tilt to mimic the sound of a non-oversampling (NOS) DAC, which naturally rolls off less aggressively. - Measurement Artifact:
If the measurement chain (cables, test interface, ADC used for testing) has a slight HF boost, it could also cause this. But since the rise is consistent across sampling rates (as shown here), it’s more likely baked into the DAC itself.
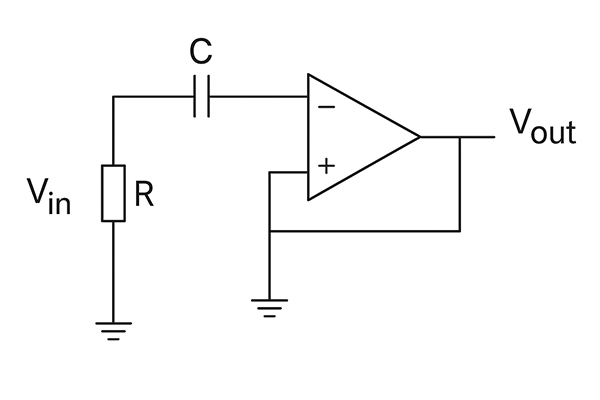
Here is a diagram of a simple RC (low-pass) network in an analog output op-amp:
Key Location of Under-/Overdamping:
● The RC network (the resistor labeled R and the capacitor labeled C) forms a low-pass filter.
● The capacitor feeds into the inverting input of the op-amp.
● Underdamping can occur if this filter interacts with:
- Output impedance of the DAC chip (driving Vin)
- Load capacitance at the op-amp output (e.g., long cables, high input capacitance of following stages)
- Op-amp bandwidth or phase margin
What Causes the Peaking (Underdamping):
● If the op-amp has a limited phase margin or a slower slew rate, and it’s driving a capacitive load, it may ring or show peaking near the cutoff frequency.
● Similarly, if R is too low or C is too high, the RC time constant can push the filter corner frequency too high for the op-amp’s bandwidth, again causing instability or peaking.
How to Check:
● Simulate the circuit (e.g., in LTSpice or Falstad) and watch the frequency response.
● Look for a peak before the roll-off.
● Increase R or reduce C slightly to reduce peaking (i.e., increase damping).
Other Possible Contributors to Underdamping:
| Cause | Explanation |
| High op-amp output impedance | Makes it more susceptible to capacitive loads, reducing phase margin. |
| No isolation resistor | Without a small series resistor (~50–100 Ω), capacitive loads can destabilize output. |
| Aggressive digital filter slope | If the DAC’s digital reconstruction filter overshoots, it can add peaking. |
| Insufficient feedback compensation | Some circuits require extra compensation to handle capacitive loading. |
Solutions:
● Add a series resistor (like 47–100 Ω) at the op-amp output before any long cables or caps.
● Choose op-amps with low output impedance and high phase margin.
● Optimize the RC filter values for damping.
● Simulate the full output stage, including load capacitance.
The high-frequency rise in the Geshelli JNOG3 plot could just as well be the result of noise shaping from the DAC’s delta-sigma modulator, rather than (or in addition to) analog underdamping.
How noise shaping causes a “rise” in frequency response plots:
- Delta-Sigma DAC Architecture
- These DACs push quantization noise out of the audible band (20 Hz – 20 kHz) into higher ultrasonic frequencies.
- This keeps the audible range extremely quiet while concentrating noise energy in the ultrasonic range (often starting just above 20 kHz).
- Measurement Effect
- If the analyzer plots amplitude in dBV across the full frequency sweep, that rising ultrasonic noise floor looks like an increase in “signal level” at high frequencies.
- On a frequency response plot, this manifests as a slight upward slope or bump before the brick-wall roll-off.
- Filter Interaction
- If the reconstruction filter is gentle (slow roll-off, minimum phase, or NOS-like), more of that shaped noise leaks into the measurement.
- If the analog stage doesn’t strongly attenuate above the audio band, the shaped noise peak is even more visible.
How to distinguish between noise-shaping rise and analog underdamping
| Symptom | Likely Cause |
| Rise appears in noise floor measurements, even with no test tone | Noise shaping |
| Rise is narrow and near the filter cutoff | Analog underdamping / resonance |
| Rise magnitude changes with digital filter mode (sharp, slow, NOS) | Noise shaping influence |
| Rise magnitude changes with cable length or load capacitance |
In any case, the peaking in the JNOG3 frequency response graph is far above the capability of human hearing and only about 0.25 dB in height.
I calculated the approximate -3 dB cutoff frequencies for the four sampling rates from the Geshelli JNOG3 DAC frequency response graph. In this graph, the flat response is at 3 dBV, so we are looking for where each curve drops to 0 dBV (3 dBV – 3 dB).
44.1 kHz sampling (red curve)
● This drops sharply right after 20 kHz.
● Estimated -3 dB point: ~21.2 kHz
96 kHz sampling (green curve)
● Rolls off after 40 kHz.
● Estimated -3 dB point: ~44.3 kHz
192 kHz sampling (blue curve)
● Rolls off before 100 kHz.
● Estimated -3 dB point: ~89.9 kHz
384 kHz sampling (orange curve)
● Rolls off well past 100 kHz.
● Estimated -3 dB point: ~117.5 kHz
Summary of Estimated -3 dB Points (Geshelli JNOG3 DAC)
| Sampling Rate | -3 dB Frequency |
| 44.1 kHz | ~21.2 kHz |
| 96 kHz | ~44.3 kHz |
| 192 kHz | ~89.9 kHz |
| 384 kHz | ~117.5 kHz |
As an aside, here is a -3 dB point comparison to the FiiO K17 DAC that I reviewed recently, which also uses the same AKM DAC chip:
| Sampling Rate | FiiO K17 -3 dB | JNOG3 -3 dB |
| 44.1 kHz | ~21.8 kHz | ~21.2 kHz |
| 96 kHz | ~44.3 kHz | ~44.3 kHz |
| 192 kHz | ~89.5 kHz | ~89.9 kHz |
| 384 kHz | ~114.3 kHz | ~117.5 kHz |
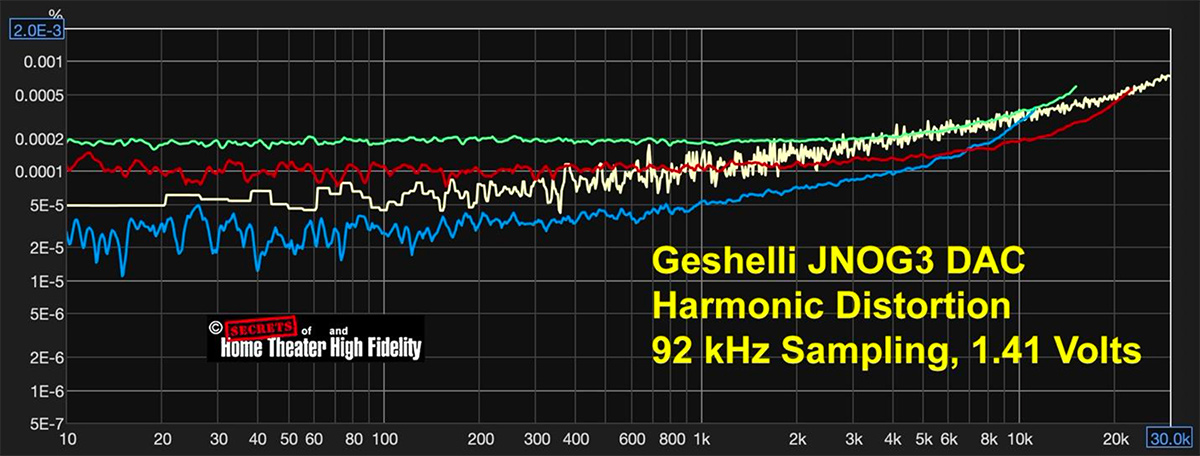
Harmonic Distortion vs. Frequency for 96 kHz sampling is shown in the figure below. Red is 2nd-ordered, green is 3rd-ordered, and blue is 4th-ordered harmonics. The white line is the noise floor. Distortion stays low throughout the audible spectrum, and harmonics for frequencies above 10 kHz are inaudible anyway.
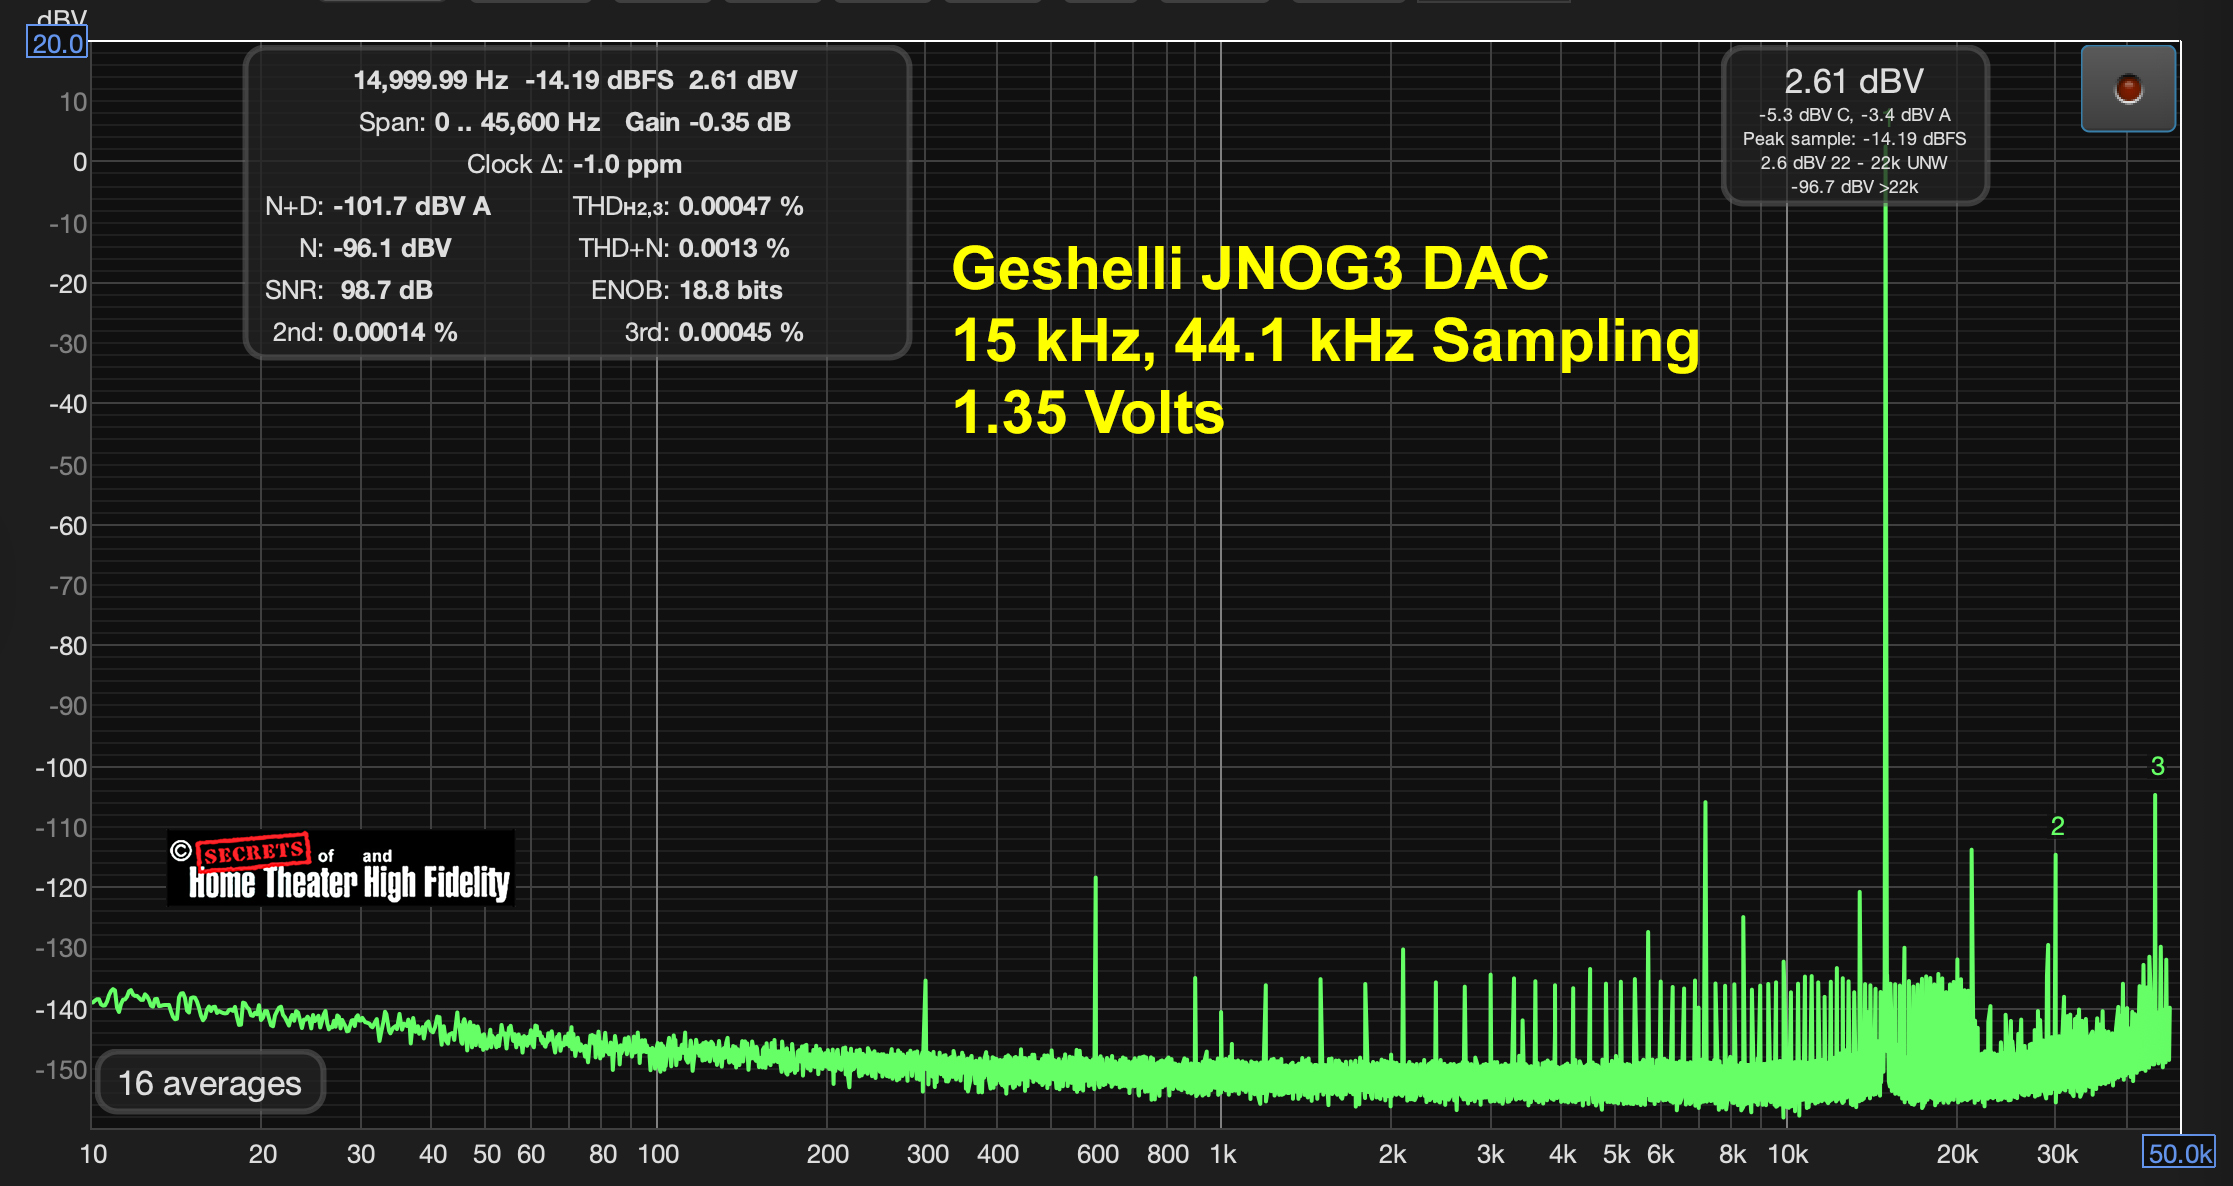
The figure below shows a 15 kHz sine wave using 44.1 kHz sampling. The dip in the noise floor above 22 kHz indicates a low-pass filter, but the 2nd and 3rd-ordered harmonics at 30 kHz and 45 kHz suggest that the filter is in front of the analog op-amp, not at the op-amp’s output. The low-pass filter does reduce the level of the noise shaping, so THD+N is only 0.0013%.
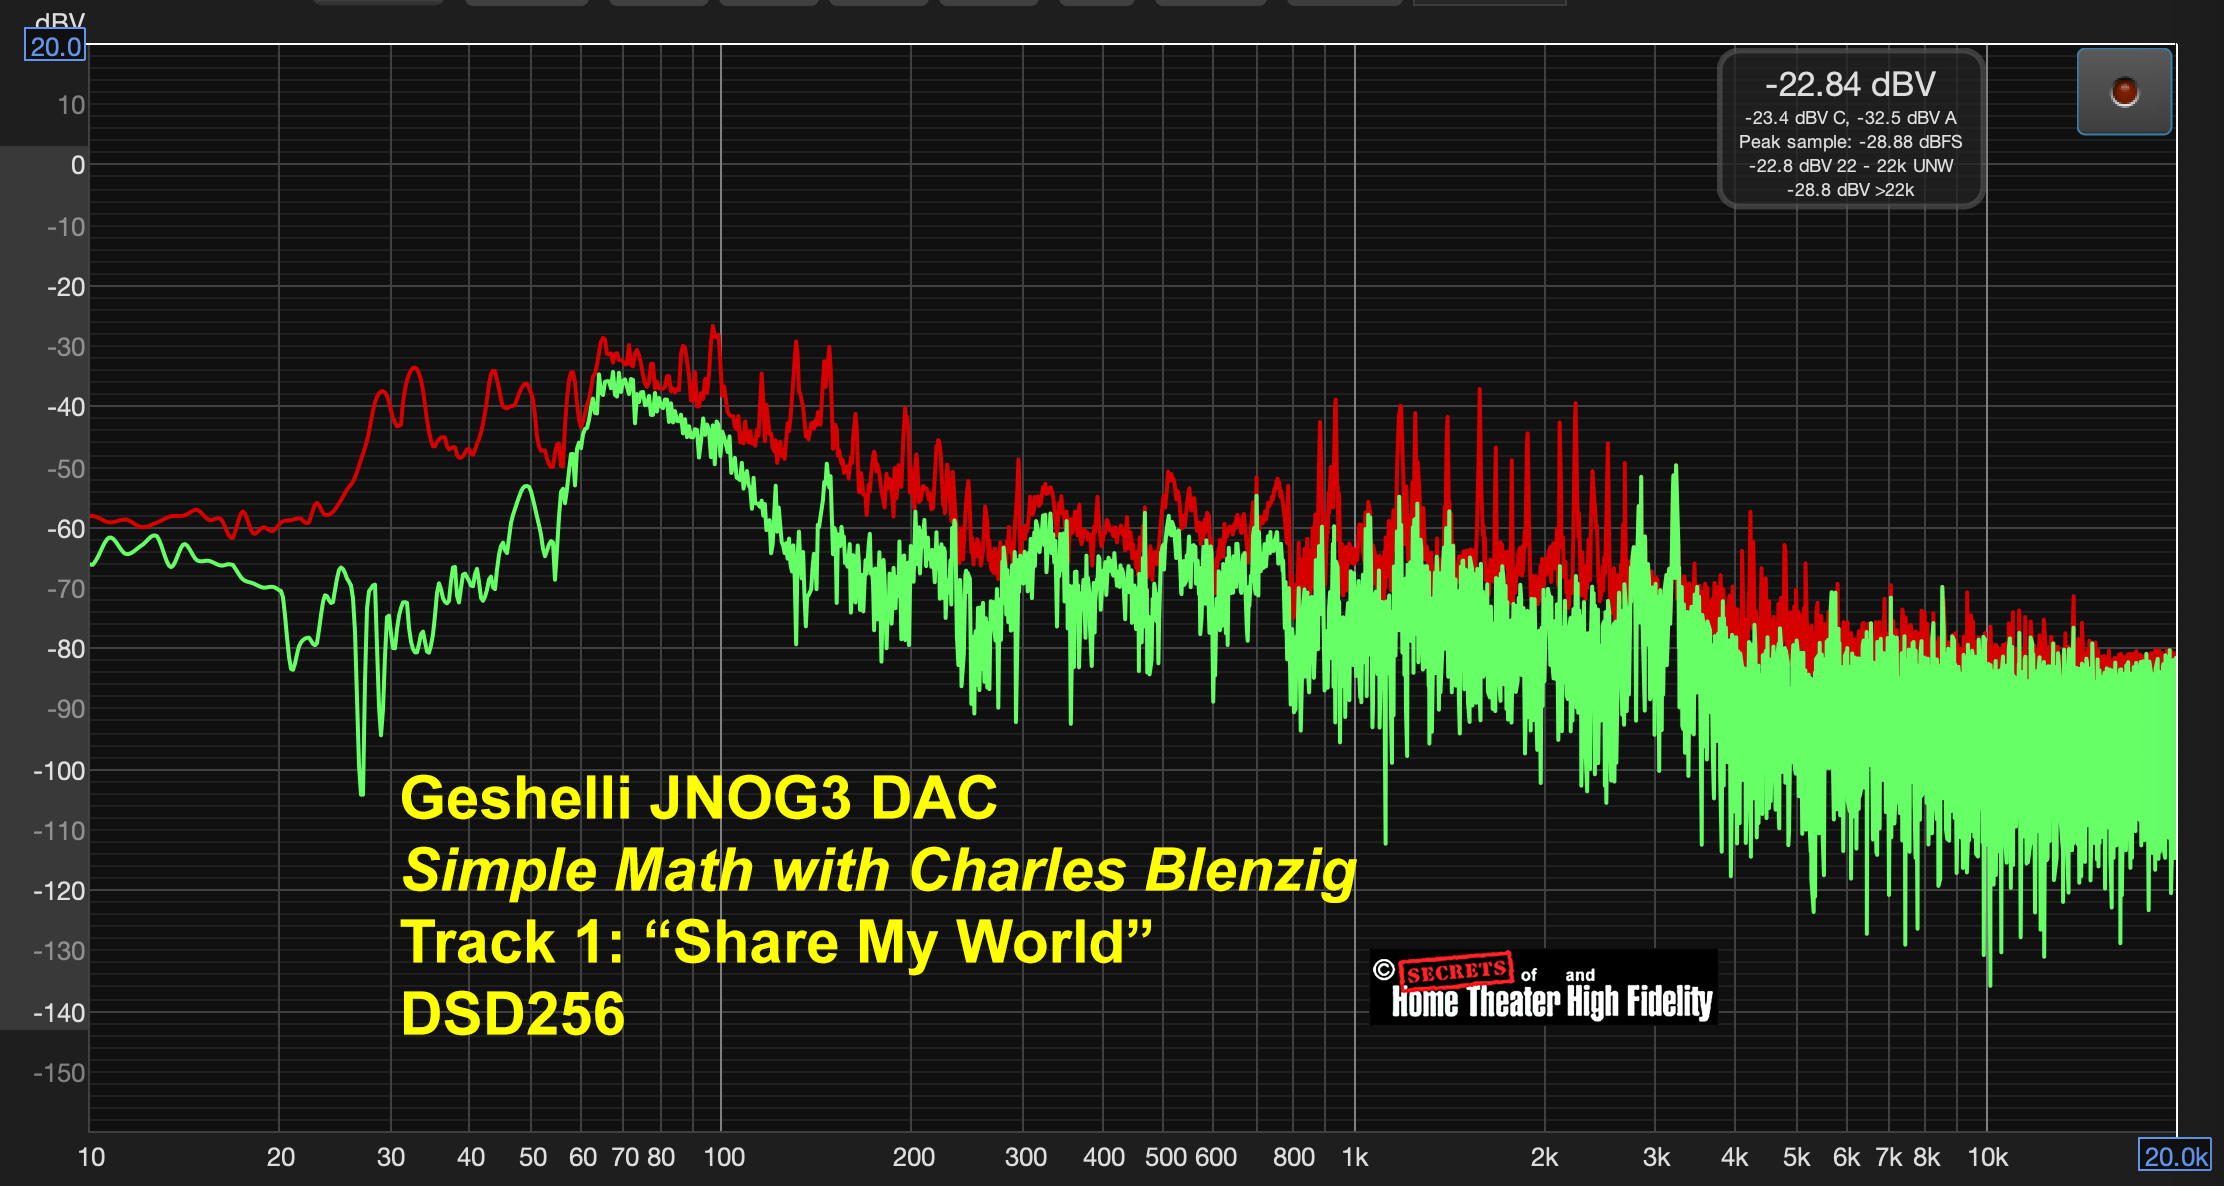
Here are some music spectra to demonstrate 352.8 kHz sampling and DSD256:
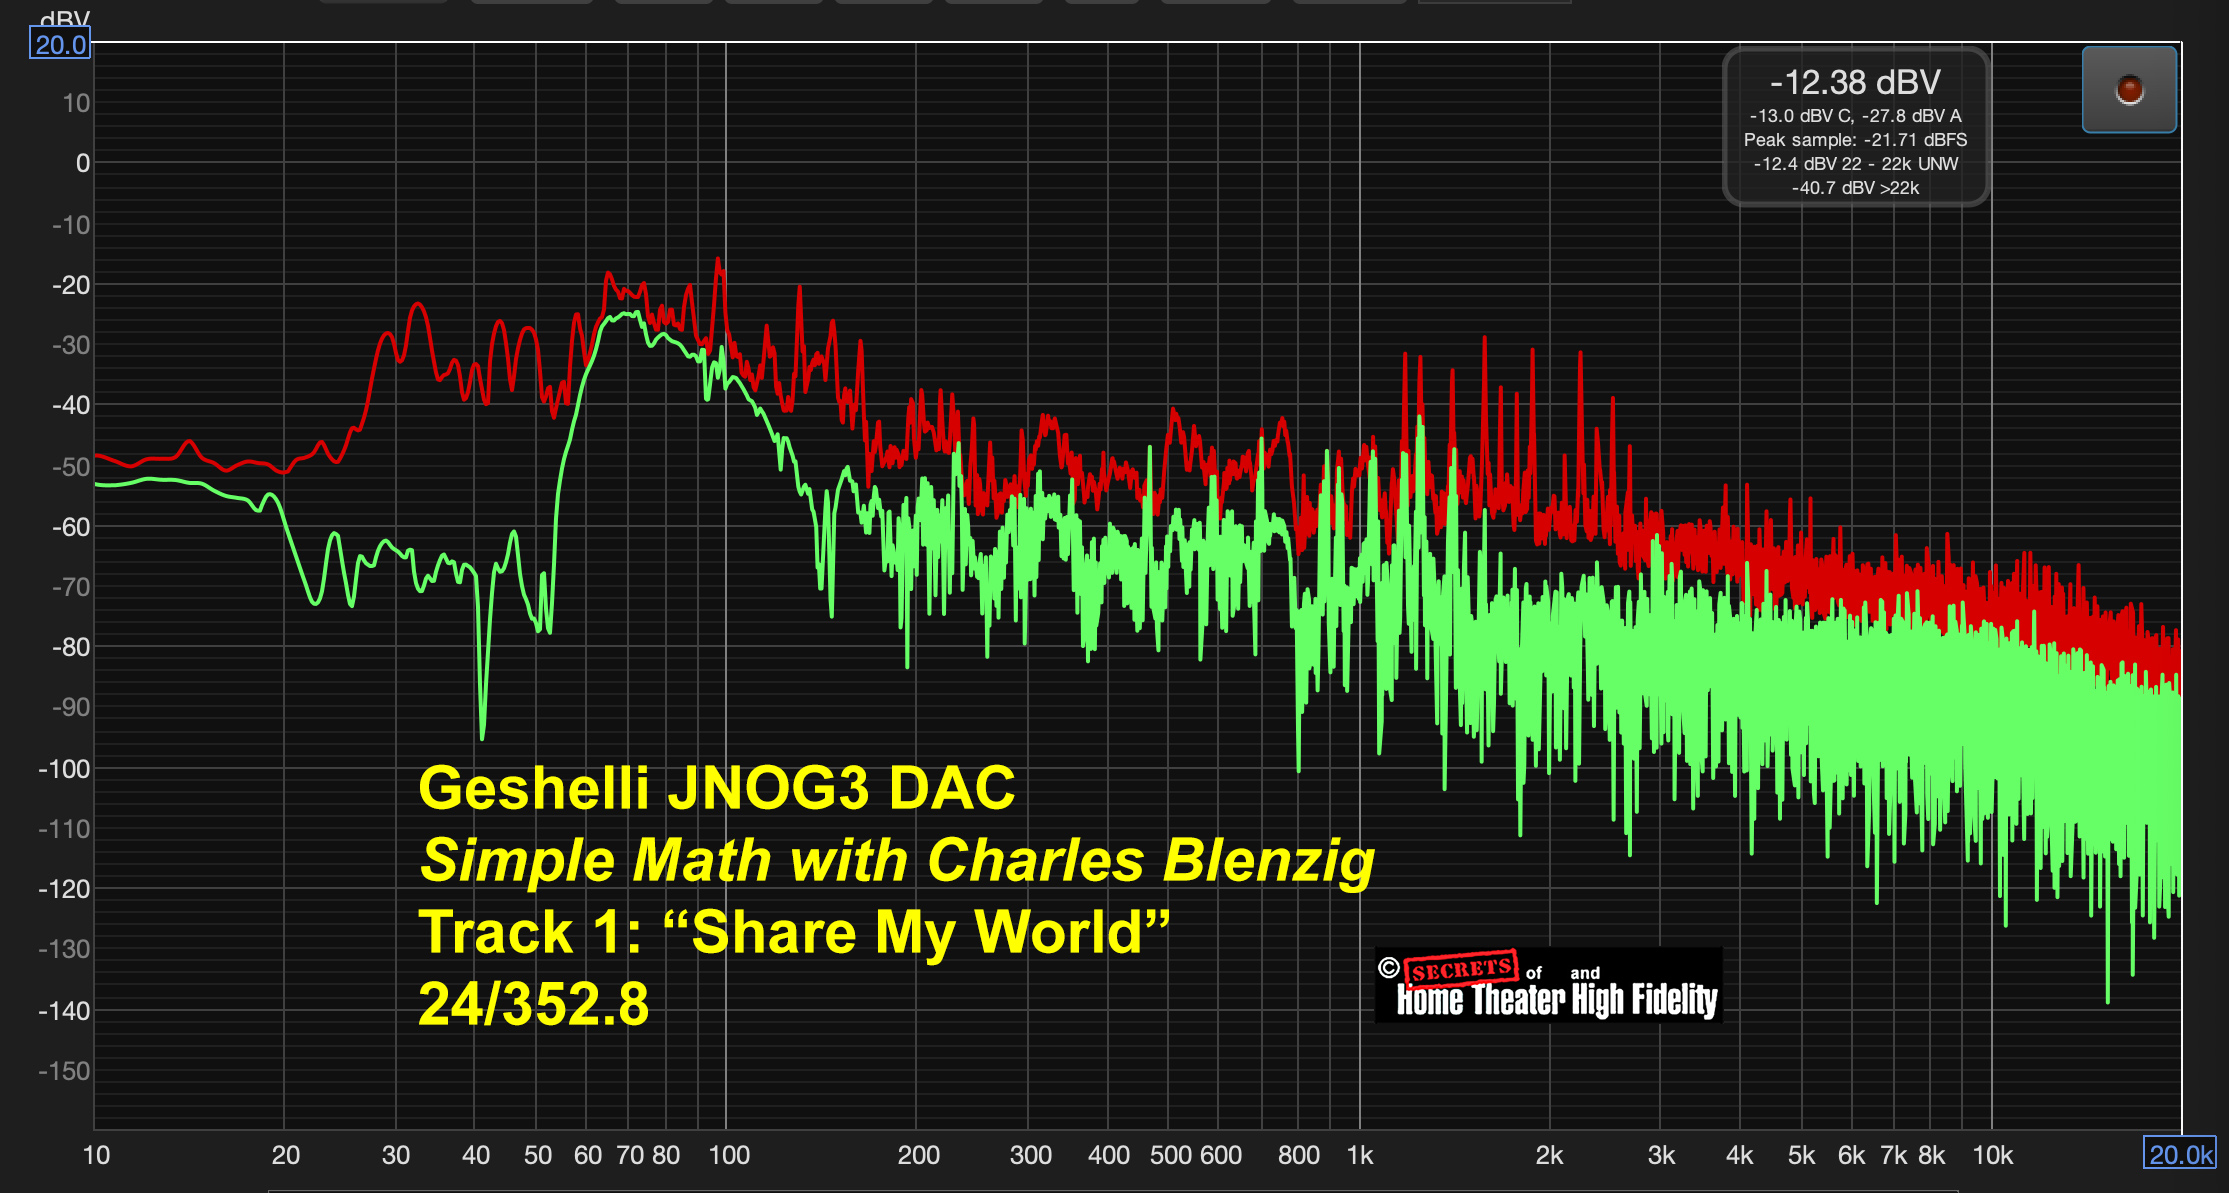
Simple Math with Charles Blenzig, Track 1: “Share My World”. 24-bit – 352.8 kHz sampling. The green spectrum is an instantaneous reading. The red spectrum is the peak sum of about 30 seconds of the track. Source: Digital Downloads from PS Audio.
Here is the same track encoded as DSD256, which is the native format that PS Audio uses for their recordings. The 352.8 kHz and DSD256 spectra are not identical because I did not capture the exact same points in the track.
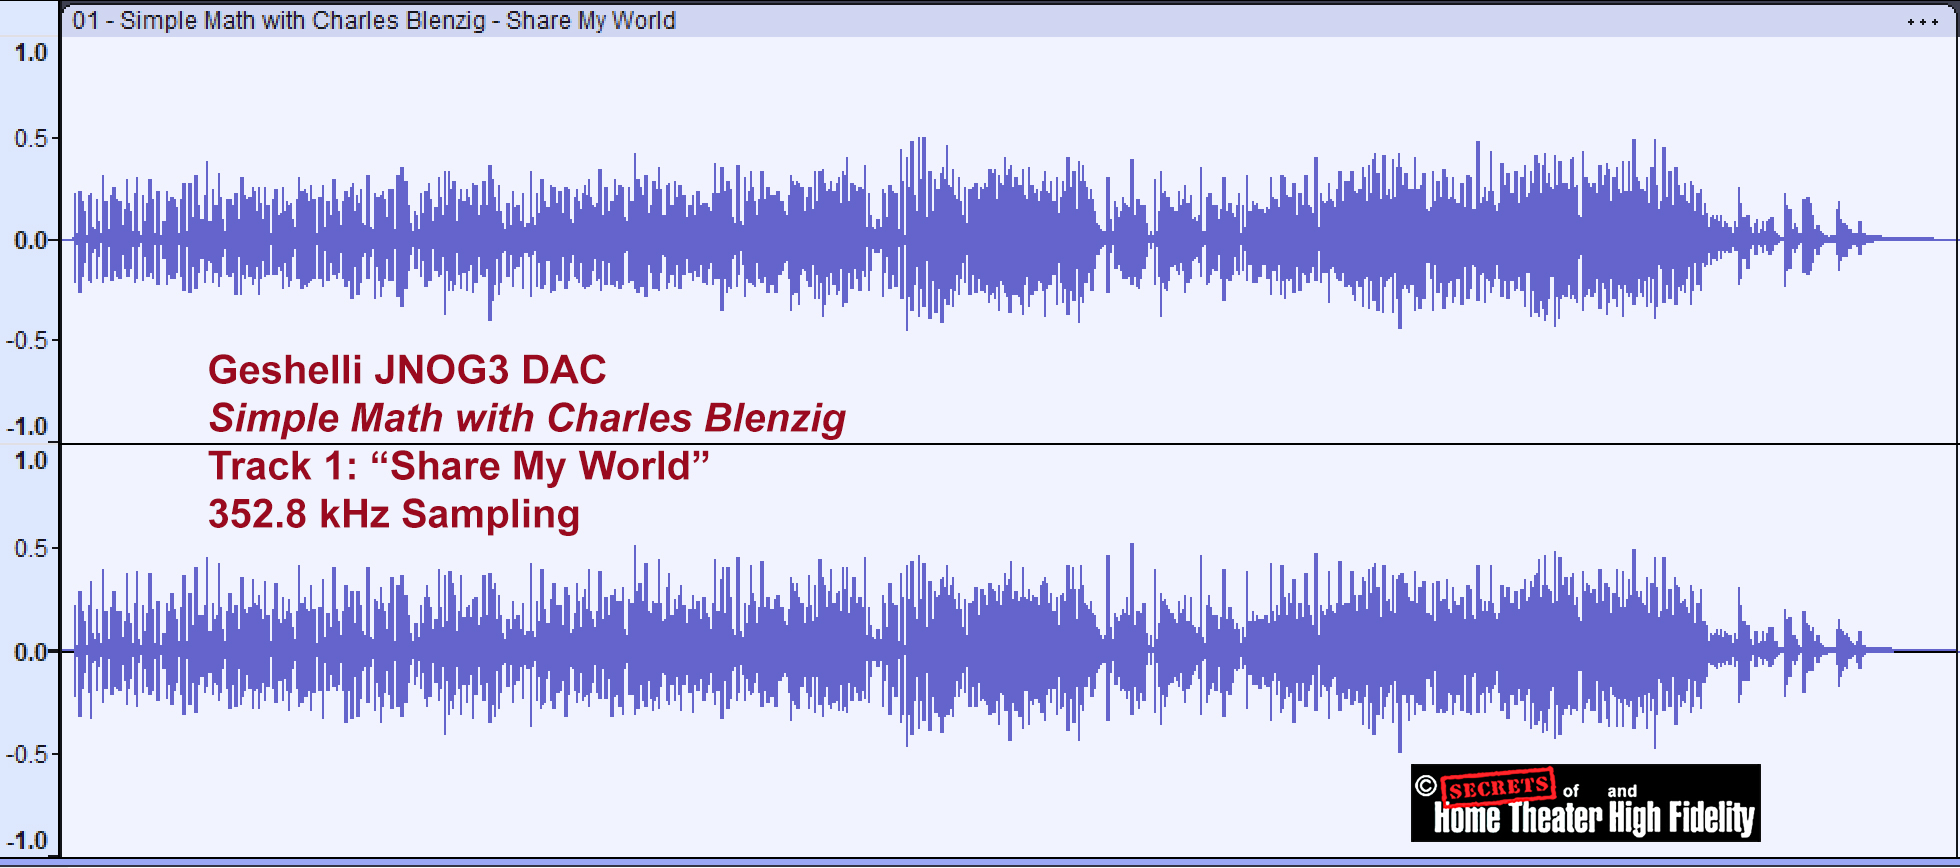
The output from the music track was not very high, so I examined the full track spectrum vs. the recording level of the digital file (no analog conversion). You can see that it, indeed, is not recorded at a very high level, probably to ensure that clipping did not occur. The highest recording level would have shown peaks at 1.0 and -1.0. The spectrum covers the entire track period of 4 minutes and 50 seconds.
It is unlikely that we will ever be able to stream ultra-high resolution music files like 352.8 kHz PCM or DSD256, but several online companies offer such music files (albums) to purchase and download. You can access such files through software music players like Audirvana and JRiver Media Center, or by using a USB thumb drive or hard drive plugged into your streamer. In the latter case, a phone app is usually supplied that lets you access the files as a “local drive” and play them.
Secrets Sponsor
Modern PCM recordings often contain ultrasonic noise shaping artifacts, especially when the analog signal is digitized using Delta-Sigma ADCs, which are nearly universal today for high-resolution recordings.
What Happens in Modern ADCs
● Most professional analog-to-digital converters (ADCs) today use Delta-Sigma modulation, which:
- Converts the analog signal into a 1-bit high-rate bitstream
- Oversamples the signal (e.g., 64× or more)
- Uses noise shaping to push quantization noise out of the audible band (20 Hz – 20 kHz)
- Then decimates and filters the result to produce standard PCM at 44.1, 96, or 192 kHz
Resulting Ultrasonic Noise Shaping
● Even after filtering and converting to PCM, some of the shaped noise remains, especially at higher sampling rates (96 or 192 kHz).
● This manifests as ultrasonic noise energy starting around 22–40 kHz and rising upward – often peaking between 40 – 80 kHz.
● You can see this in high-resolution spectrum plots of many 24/96 or 24/192 recordings.
Why It Matters
● In theory, this noise is inaudible, since it lies above the human hearing range.
● In practice:
- Some DACs may pass that ultrasonic energy to the amplifier or tweeter
- It can cause intermodulation distortion in amplifiers or drivers
- Super tweeters (found in some high-end systems) may reproduce it
- It wastes bandwidth and power if not filtered
How FLAC Handles It
● FLAC losslessly preserves all content in the PCM file, including:
- Audio signal
- Noise-shaped content
- Ultrasonic components (up to Nyquist = half the sample rate)
So, if you stream a 24/192 FLAC from Qobuz, and the original file contains ultrasonic noise-shaping from a Delta-Sigma ADC, that ultrasonic energy is still present in the stream.
Solutions or Mitigations
● Proper DAC design includes analog low-pass filtering to eliminate ultrasonic energy.
● Some DACs also include digital filters to suppress the noise above 20 kHz.
● If you’re analyzing files or building equipment:
- You may want to apply a steep low-pass filter around 30 – 50 kHz
- Use FFT to check for energy buildup above the audible band
Summary
● Modern ADCs often use Delta-Sigma modulators with noise shaping.
● This introduces ultrasonic energy into high-res PCM files.
● Qobuz and FLAC faithfully preserve this content.
● Whether it’s a problem depends on your playback system (DACs, amps, speakers).
The Geshelli Labs JNOG3 DAC is a bargain at $530. It does not have Bluetooth or Wi- Fi connectivity, but a low noise floor is the result.
- Simple, easy-to-set-up design.
- Low distortion and noise.
- High cost-to-performance ratio.
- Very cool looks.
- Bluetooth and Wi-Fi connectivity options.
- Optional sharp analog low-pass filter at 30 kHz, placed at the op-amp output, with the ability to turn it on or off (bypass) from the front.
- Optional USB-A or C port that will accept USB thumb drives or SSD drives with users’ music files stored on them. A phone app could access them and play them.
As a straightforward DAC, it excels, and if you want to add Bluetooth and Streaming options, there are several affordable solutions out there (the Arylic LP10 is one example that we have in for review) that will interface with the JNOG3 easily.


