


If a USB input is all you need, the Topping D10 does everything a good modern DAC should at a wildly affordable price.
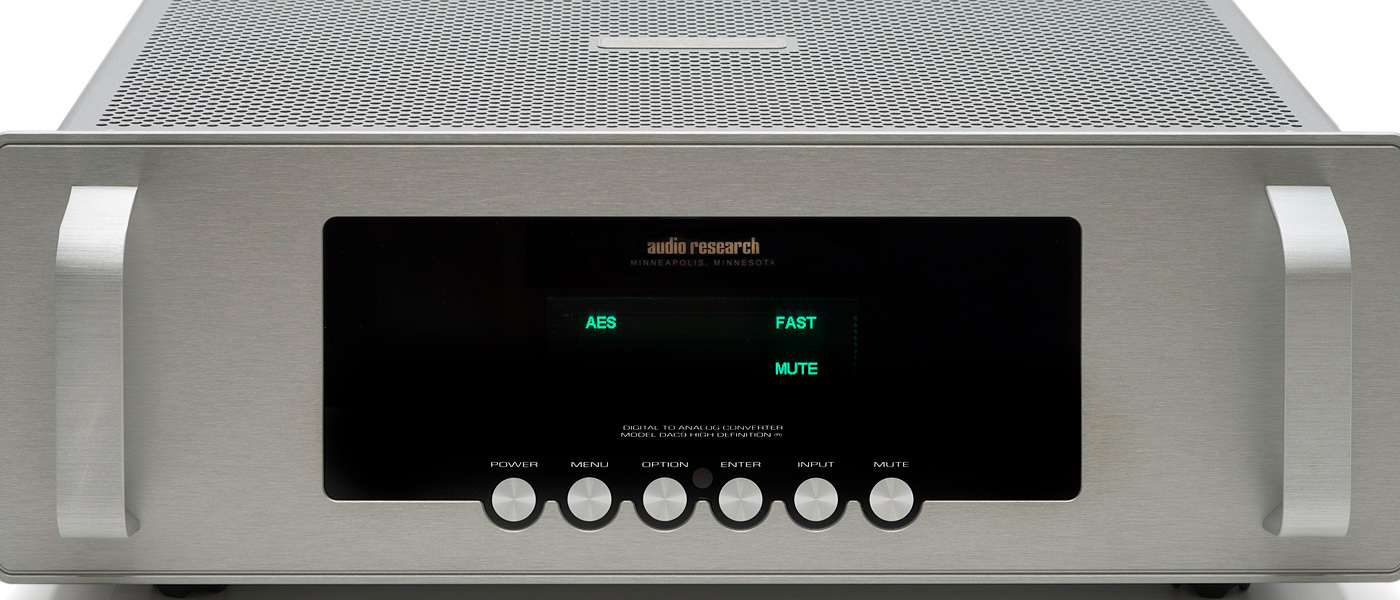
Topping D10 USB DAC and USB SPDIF Converter
- Small, unobtrusive design with an easy to read display
- Up to 32-bit/384k samples /sec PCM without custom drivers.
- USB input only
- Coax, TOSLINK digital and RCA analog outputs.
- Proper certifications for US and European Union countries

Having just purchased a new Windows 10 computer I have found myself looking more into the possibilities that streaming music could offer me as a listener. To that end, I wasn’t necessarily looking at a new DAC purchase as much as I was a USB to SPDIF converter to drive my pre/pro from my laptop. The Topping D10 seemed to fit the bill from both a price and potential performance standpoint.
Design:
2 channel desktop DAC.
DAC Chipset:
Single ESS ES9018K2M.
Inputs:
(1) USB Type-B.
Outputs:
(1) Coaxial Digital, (1) TOSLINK Digital, (1) pair RCA stereo analog.
Sample Rates:
Up to 32-bit/384k samples/sec PCM with Windows 10 drivers
DSD files:
DSD64-DSD256 (Native) DSD64-DSD128 (DOP) via USB using Topping custom drivers.
THD+N (1 kHz – 10kHz):
<0.0008% confirmed by Secrets Lab Test
SNR (1 kHz):
115 dB (A-weighting) confirmed by Secrets Lab Test
Line Output Level:
2.0 V @ 0 dbFS confirmed by Secrets Lab Test
Output impedance:
100 ohms.
OPT/COAX Output sample rate:
44.1-192 k samples / sec – 16-24-bit
Colors:
Black or Silver.
Dimensions:
5.7” L x 4” W x 1.5” H.
Power input:
5 VDC/0.5A (USB powered).
Website:
Company:
SECRETS Tags:
dac, topping, digital, usb, USB DAC Review 2020
So what’s in the box? The DAC IC is the ESS ES9018K2M. Unlike the more familiar ES9018 multichannel part, ESS chips with the K2M suffix are low power two-channel parts designed mainly for mobile use. Their measured performance is not as good as the multichannel chip of the same call number. That being said, somehow Topping has achieved much better performance than is typical with the ES9018K2M. When examining the board, nothing looks very different around the DAC when compared to the lesser performers we have tested using the same chip. The D10 has high-quality opamps and power supply components but I do not see any mystery magic parts. Whatever Topping does to achieve the performance I found in the D10 is magic.
I did not take the box apart, but you can see the internals on the internet if you look for images of the Topping D10.
Looking at the PC board and the certification documentation it is unclear how it sells at this price.
To appeal to tweakers, Topping allows you to replace one of the opamps in the signal path since it is in a socket. Take my advice and leave it alone. If you swap it the performance of the unit will drop like a rock.
The Topping D10 talks directly to Windows 10 computers with the latest updates, hence my computer upgrade. It is simple to change the sample rate to a high-resolution using the Speakers Properties panel in Windows 10.

To get this panel, go to the Windows Settings icon then select System, then Sound, select the D10 in the Speakers box (or Output Device box depending on your version of Win 10) and hit Device Properties.
I do not know what Microsoft did to get high-resolution DACs to connect directly without ASIO drivers. Macs are said to have always done it. If you want to play DSD however, you need a Topping third-party driver which you can download from their site. Windows had no idea what a DSD file was.
Note the Windows 10 High-Resolution Driver up-samples. If you select 384k samples/sec that is what the Windows driver will put out and that is what the Topping front panel will show. In this case, Windows is up-sampling to 384k samples/sec regardless of what the file sampling rate is. Up-sampling does nothing for the sound and introduces unnecessary signal processing. You are not getting a bit-perfect representation of the file at the USB output. The DAC is getting pushed to its maximum rate for no reason and this reduces performance.
I think it is better to bring the sampling rate down to the maximum rate of the file, for example, go down to 24bit 96k samples/sec if the file has a sampling rate of 96k samples/sec. If the file exceeds the sample rate of the DAC box, the Windows 10 driver will down-sample it to 96k samples/sec. That is a required function. For the internal sound card in the laptop, everything gets down-sampled to 48k samples/sec.
The web has almost no information on the Windows 10 High-Resolution driver that connects directly to USB DACs. I have no idea what number the Microsoft update was. Microsoft provides zero information on it. Nobody has published “Microsoft High-Resolution Driver, The Missing Manual”. WASAPI is a term used for some form of the Microsoft audio driver but a search on it, restricted to 2019, dug up little. I have no idea if the new Windows 10 driver is an improved WASAPI or something else.
Secrets Sponsor
No need to spend any money on a High Res player. You have a poor one installed on the Windows 10 computer called Groove Music. Microsoft documentation on Groove Music is also minimal on the web. It does not match the sampling rate of the file to the Windows driver leaving you to overclock the DAC. Getting gapless playback may not be possible as posts to the Microsoft forum had only rubbish for an answer.
All my electrical tests originally were run using Groove Music, all the while Carlo Lo Raso was telling me to download something better. I was not about to spend any money on this project so I kept Groove Music going. I had some strange results which I originally thought were from the DAC then I gave in and downloaded the free Foobar2000 audio player. This is said to be very hard to set up. I got it up and running relatively easily and worked with it for a while, but then I found quirks that require searching the web and some results gave conflicting suggestions. It is worth the effort since it is free and the GUI is fabulous for me. This is for fans of Windows 7 in XP mode for which I am steadfastly one.
With Foobar, all the distortion and noise issues I was seeing with Groove Music went away. Every spectrum I show below had to be replaced flushing 20 hours of work with the image preparation (I did not sign up to do graphics, the print magazines had staff, but this is what web publishing is like). Next time I will listen to Carlo when he tells me something. Foobar is still a little flakey. It will mute at times if the computer is busy doing other things. It can mysteriously open a window when you’re looking to confirm a setting. It also completely froze once requiring a system restart.
Groove music tried to group all my .wav files to create playlists. It was just one file away from playing my 1kHz 0dBFS test tone which Groove music thought was a really great file to play. My speaker’s midrange would have been gone in a second. Foobar2000 would never do that.
I was going to describe how to set up Foobar2000 in this review but in the end, it needed too many screenshots. In the future, I may try to give you a brief setup guide, after I have used Foobar longer, found more issues, and hopefully learned how to correct them.
Foobar2000 does change the Windows driver sampling rate to the source rate so you do not have to worry about the oversampling issue. The Topping shows the sampling rate of the source when using Foobar2000. It will also do the same with other media players like J.River Media Center, etc.
I did run into a small problem when I used the test tools in REW or Audacity to create test tones and played them back directly instead of saving them first and then going to Foobar. This has nothing to do with the Topping but is a Windows driver interface issue. When I tried to create a 0dBFS tone, REW came back with a warning that the signal was clipping. It was a tiny clip but the noise floor was up along with the distortion. It got better at -0.1dBFS but did not resolve until -0.2dBFS. Audacity did not indicate clipping of the file (it will show that) but the results were the same as REW when I played the files inside Audacity. I had to come down 0.2dBFS.
The clip levels are so small they are not audible but something is happening with the way the Windows driver is being sent the data. Foobar knows what to do to send bit-perfect data down USB but I could find no setting I could transfer to the other programs.
Secrets Sponsor
Adjusting the Windows volume control does nothing. The clipping is before that. Help from a reader well versed in getting bit accurate data down USB with the Windows driver would be highly appreciated.
Topping has custom drivers, but I did not use them. I was not willing to put unknown drivers on my PC when the Windows drivers are clean up to a tad below full scale when not using Foobar. These custom drivers are needed to playback DSD files. Topping supplies a 19-page instruction sheet for setting up Foobar to play DSD and a similar setup sheet for J River. This is on top of the 10 pages worth of Topping instructions to install the drivers. The driver instruction is contrasted to the user manual which is tiny and in multiple languages.
Curious to see what this $90 DAC could do I hooked it up to my spectrum analyzer before I heard a note of music. Back came the performance of many $900 DACs. SNR = 115.5dB, A-Weighted, which is almost 19-bit performance and THD of 109dB (0.0004%) at 1kHz and 10kHz (band-limited to 20kHz) approaching the distortion resolution limit of my spectrum analyzer. The largest IM tone from the -6dB 18KHz/19kHz test was -110dB down. The results are almost the same at 192k samples/sec as 48k samples/sec. I did not test 384k samples/sec but instead listened to DXD files.
There is no funny reconstruction filter that is said to sound better. The Topping has a high-performance FIR that is flat to 20kHz and has a sharp stopband down 90dB. The output at 0 dBFS comes in at 2VRMS, the industry standard. Channels were remarkably well matched in all tests. It is 0.5dB down at 80kHz!!
I have a complete set of measurements below but nothing on the market at $90 will produce numbers within an order of magnitude of what I measured above. You could stop here and run out and purchase one but I’d advise you to please read my next section on shopping advice when purchasing small brands from the Far East first.
Topping is a real company not some fly by night group on eBay
Topping is not to be confused with many China-sourced audio products that can be found on eBay or Amazon third-party sellers. These sources are to be avoided as I have had trouble with Amazon’s third-party sellers in the past. I’ve had fewer issues with eBay which has better seller ratings from confirmed customers. The Wall Street Journal has had many investigative pieces on unsafe and/or counterfeit products from Amazon’s 3rd party’s sellers.
Topping is different from other no-name DAC supplies as I will discuss below. In figure 3 I show how to get Amazon to display only products they sell directly.

Amazon sold me the Topping D10 direct (it arrived on December 9th) and is now number 1 in the amplifier category (that is where Amazon puts DACs) and #11 in all of home audio electronics. It is also available from one of the “to-be-avoided” 3rd party sellers on Amazon. Set up Amazon as I show you above and you will not see that offering. You can see other Topping products being sold by Amazon on the page when I did the screenshot but the D10 was out of stock on the day I did this screen scrape, close to Christmas.
Parts Express, a well know reputable dealer, also sells Topping products. Both give 60-day returns but Parts Express requires you to pay for shipping.
Amazon, in theory, is not going to sell direct a product that lacks FCC certification for radio emissions, although the latest Wall Street Journal article cites issues about some products they looked at sold directly from the Amazon site. Both Carlo and I have discovered clones of certain Topping products for sale on Amazon. We each found examples where the photos and description looked like legitimate Topping items but the manufacturer name at the top of the listing (in small blue print) was different. Two of these companies were Aimpire and Fiesand. There may be more. If you are purchasing a Topping product on Amazon, make sure Topping is indicated as the manufacturer at the top of the listing. Otherwise you may be purchasing a cloned product of dubious ability and pedigree.
Topping gets the FCC certification and proudly displays it on the company’s website. I have taken the photo from the Topping website and placed it as figure 4.

We have more than one piece of paper here. The European safety CE mark shows conformity with health, safety, and environmental protection standards for products sold within the European Economic Area. Two CE conformance documents in the figure apply to different standards but the photo is too fuzzy to see which document is certifying what standard.
The unit also has RoHS certification. “This directive restricts the use of six hazardous materials in the manufacture of various types of electronic and electrical equipment”.
You can see the certification on the back of the unit in figure 5.

The figure also shows a key feature of this unit, indeed the only feature I wanted, USB streaming conversion to SPDIF. Those are output, not inputs. The D10 takes a USB input and provides a SPDIF output (coax and optical) so any product with a DAC in it becomes a USB streaming DAC.
Most, but not all, Topping products show certification paperwork in the product description on the Topping website. Of more of a concern is that some products claimed to have paperwork do not show the marks on the rear of the product on the Topping site. This may just be that the photo session occurred before the certifications came in. I have seen that happen before for products I know are fully certified. More worrying is some reviews show Topping products without the marks although it is possible they could have been given a pre-productions sample. If you get a Topping product and you do not see the marks this is what the 30-day return is for.
For me, the purchase of the D10 was just to get the USB stream converted to SPDIF. I initially thought that such a product would be cheap but most boxes that do it are expensive for reasons I do not understand. The D10 has that function at $90 so I purchased it simply for that.
OK, now you can stop reading since what is below is just a confirmation of the executive summary.
Carlo Lo Raso has tested many DACs. To prevent correlation errors he sent me his test files to work with.
All tests are done with a Lenovo E595 Windows 10 computer fresh out of the box connected with a USB cable to the Topping D10. I did not load the custom drivers available from Topping. This is a $90 product designed for the music lover wishing to listen to high resolution streaming. We cannot expect those customers to be futzing around with drivers that could cause unexpected problems with no help desk available if issues crop up.
All tests are with Foobar2000 playing back files.
Introducing our Co-star of the Bench Test the Quantasylum QA401 Audio Analyzer
I am using the Quantasylum QA401 Audio Analyzer ($449). I have the performance of the QA401 and design of the QA401 mixed in with the Topping D10 bench rest results. This is the first review in Secrets to use the QA401.
DAC testing is all about the ADC in the Audio Analyzer and the analysis software. The QA401 has the AKM AK5397 which is the lowest noise ADC on the planet (using 8 channels of another AKM DAC in mono gets a better SNR). Distortion performance is not quite as good with the AKM AK5397 with some other AKM ADCs doing better. Thus including the AKM ADCs with 8 channels in one package. ESS does not make ADCs
The QA401 Audio Analyzer is USB powered which limits its performance below what the AKM AK5397 could do with a good line-powered power supply. I would pay $1000 for a line-powered QA401 with some level adjustment before the ADC and DACs. I would also like an added ADC and DAC in a mono configuration, but that product does not appear to be something Quantasylum is going to produce.
The QA401 analysis software is close to AP quality including SNR in the presence of a test tone that is not even available on the older Audio Precision Analyzer that Secrets owns. It is on the latest Audio Precision units. The QA401 is smart enough to identify harmonics from the test tone and does not use those FFT bins in the SNR computation. SNR can drop when a signal is present which is why this readout is so important.
Now back to the Topping D10
Let’s see what that the D10 performance looks like. Figure 6 is a 1 kHz signal at -40dBFS. The sampling rate is 48k samples/sec.

Note all these spectra are with a Hann window for the best resolution of noise and distortion. The absolute level of the tones varies slightly with frequency using the Hann window. For flat frequency response, you want a Flat Top window, but you trade resolution. The first spectra should show 20mVRMS or -34dBV but shows 18.9mVRMS instead. I marked the correct values of the amplitude on all the spectra plots correcting for the Hann window. Note the full scale signal (0dBF) is 6dBV (2VRMS). When I use a -40dBFS digital signal, which is 1/100 the voltage level, output drops to 20mVRMS (-34dBV). This is the 6dB difference from the digital signal in dBFS and the voltage output in dBV
Note only a small 2nd harmonic distortion product at -135dB and no hum components at all. How is that possible? This test is all done on batteries. The Topping D10 is USB powered and so is the Quantasylum QA401. I drove the Topping with a Lenovo E595 and the Quantasylum was on a Lenovo T560. Why am I mentioning Lenovo? Other computers may have noisy USB power outputs and you will not get these results.
We could see radiated hum from other devices in the room but Topping has done a good job of isolating the unit. I removed radiation to the RCA cables by using 2-inch ones with the D10 DAC sitting on top of QA401. Again this is RCA not XLR results. You cannot expect XLRs at $90.
A discontinued Anker USB data hub was recommended by Quantasylum as a potential path to reduce USB noise. Those who like playing with USB cables now have a new box to put in the mix if you have a computer with noisy USB outputs. Of course, you will not know if your computer has an issue with USB without a high-resolution spectrum analyzer. Long USB cables can cause trouble since the D10 is drawing 0.5 amps and the supply voltage will drop. Some USB DAC boxes draw more current. USB has a max current draw and some fly by night DAC boxes may come close to exceeding it. The D10 got warm telling you power is coming into it from the USB. If you are paying more than $90 you want a line-powered USB DAC.
The QA401 has the test SNR in the presence of a signal. As discussed above we can get the SNR of the DAC with a signal still present so we can see any effect the signal might have on the noise floor. Figure 7 shows what happens when I put it to work.

I have switched to A-weighting. You can see the curve in the noise floor. I also have the grounded self-noise of the QA401, on the other channel (red), showing the QA401s noise limit which is well below the D10.
The signal is -60 dBFS signal which is 2.00mVrms (-54dBV) corrected for the Hann window. The SNR reads 55.5 dB for a -60 dBFS signal. I marked the spectrum that shows the data.
For the full-scale SNR, we subtract the digital signal level (-60 dBFS) from the SNR. We are playing with logarithms here since dB is on a log scale. Subtract logarithms and you do division. Note I am using the digital signal level (dBFS) not the output voltage level (dBV). The result is:
SNR =55.5dB (SNR) – (-60dBFS) (digital signal level) = 115.5 dB.
SNR of 115.5dB is close to 19-bit performance. To be exact 18.8-bit equivalent.
In Figure 8 I go down to an input signal at -130 dBFS.

The SNR reads -15.5 dB. I marked it on the spectrum. You can also see this signal has an amplitude of 632nVRMS correcting for the Hann window error. Note this signal is so tiny it is in nano volts. It is that small at -130dBFS. The signal is below the integrated noise floor (115.5dB calculated above) but the FFT processing gain makes it visible along with lowering the noise floor of the spectrum analyzer (I have an article on this coming up soon). We use the same procedure we used for Figure 7 to get the full-scale SNR by subtracting the signal level (-130 dBFS) from the SNR at that level (-14.5 dB) and once again get 115.5 dB SNR.
-14.5dB –(-130dBFS) = 115.5dB.
I am showing only one channel so you can see the analyzer’s residual noise floor, with a shorted input, but both channels of the D10 produced the same results.
Topping D10 DAC line linearity was perfect to -130 dBFS. I have had trouble getting stable line linearity below -130 dB with the QA401, even with the Benchmark DAC, so I am not reporting sub -130 dBFS line linearity here. This may be the AKM ADC in the QA401 performance limitations. This is most likely the USB power supply limitations in the QA401 but recall the Topping is also on USB power and only has RCA outputs at 2VRMS not 4VRMS for an XLR output. Without a better spectrum analyzer, I cannot blame the Topping.
I was able to resolve a -145 dBFS, 1 kHz tone, above the FFT processed noise floor (not shown).
And now back to the co-star the QA401 Analyser
As you can see from the shorted noise floor the QA401 has at least an 8dB margin below the D10. The noise floor is at least at -117dBV A-weighted if the USB line power is good (spec RMS noise from 20 to 20 kHz is -115dBV). Since the QA401 can accept signal up to 12dBV (4VMS) the total SNR it can measure is 129dB although I lost 6dB of that since the D10 only puts out 2VRMS. Again the QA401 performance would be much better with line power and mono ADCs. Like Godot, I am waiting for Quantasylum to show up with one but it never comes.
My QA401 spectrum analyzer has an AKM AK4490 DAC to generate test tones (the other side of an AP but only analog tones). That has a 118.5dB SNR (ref 2VRMS), with the QA401 in loopback, which is less than expected from the AK4490 and likely shows the limit of USB powered products on the DAC side. The AKM AK4490 distortion performance in the QA401 was not as good as the Topping D10 which I think indicates the ESS ES9018K2M DAC in the Topping is a better performer although I do not have the ESS data sheet to compare.
A couple of words on the Topping D50s and the issue of USB vs. line power
To significantly exceed the Topping D10 performance you’ll need a line-powered DAC box. Indeed the next up Topping D50s ($250) can be paired with an external power supply, designed for best performance, although the D50s will run on USB power. The D50s draws twice the power of the D10 at 1 Amp making a voltage drop with long USB cables more significant. A wall-wart power supply, splitting the difference between the big external box supply and a direct USB supply, is included with the D50s but the instruction guide gives no indication when to use it or what performance increase you get if you do use it. I saw a 3rd party AP SNR measurement of 118dB on USB power (not surprisingly about what the USB powered QA401 does) but the spec is 122dB which I guess it reaches with one of the AC power options. Unlike the D10, the D50s have no SPDIF optical and coax outputs. I think the D10 is unique in the Topping line with those digital outputs.
Now back to the D10
Figure 9 shows a 1 kHz THD at 48k sample/sec rate at 0dBFS (2VRMS).

Figure 9 shows the distortion I measured at -109.5 dB or 0.0033%. I marked the part of the spectrum that shows the THD. Red is the right channel and green the left in the spectrum. Both channels return almost the same THD. This is getting close to the distortion limit of the USB powered QA401 and is likely another USB power issue.
I switched the Y-axis to dBr. The reference level was 2VRMS. The spur level can thus be read directly without having to add 6dB. Note the amplitude in the spectrum is again off as a result of the Hann window showing 1.87Vrms but the ratios between full scale and the harmonics are correct. Using the Flat Top window I verified this was 2VRMS.
At 96k samples/sec and 192k sample/sec, the THD hardly moved to -108.4dB. Given the small change, I did not show these spectrums
QA401 Spectrum Analyzer sampling rate limitations (192k samples/sec) preventing testing at 384k samples/sec but I did listen to a number of DXD files from the 2L sample download website.
Moving the test frequency to 10kHz (not shown) the Topping D10 2nd harmonic was at -116dB (0.00016%), and the D10 hardly moved to -115dB at 96k samples/sec and -114dB at 192k samples sec. Harmonics beyond the 2nd were not observable with the spectrum analyzer at 48k samples/sec sampling rate. The QA401 performs better at the lower sampling rate which is a USB powered ADC limitation. Also, note the noise is up as a result of the QA401s 20dB attenuator in the signal path. The QA401 ADC distortion degrades if the signal is above 200mvRMS so I traded noise for distortion accuracy by using the attenuator.
Figure 10 is the 19 kHz / 20 kHz each -6.0 dBFS (1.0VRMS) the full-scale analog output.

We do the test at -6 dB since the two tones have a maximum peak value corresponding to a single tone at 0dBFS. No spur above -111dB or 0.0003% are seen. Again the X-axis is in dBr so the spurs give the distortion level directly on the spectra. The spurs did not increase as I took the Topping D10 sampling rate up to 96k samples/sec and 192k samples/sec. Again all these distortion measurements are very near the THD of my QA401 test system. The Topping could be a little better than my numbers.
I tested the frequency response of the unit using the Flat Top Window and found it is flat to 20 kHz (not shown) at 48k samples /sec rate.
Now, do you respect this $90 DAC!!!
Does the topping produce tones above 20kHz?
Let us start with Figure 11.

Here is a 40 kHz tone sampled at 96k samples/sec rate. The level is 0dB. This time I used the Flat Top window to get the best estimate of the gain of the signal. This is a 0dBFS tone. Note the X-axis of the graph is dBr with 0dBr at 2VRMS.
Note the peak amplitude is 1.95VRMS down -0.2dB from 2.0VRMS full scale.
The sub-harmonic spurs are likely from the QA401 spectrum analyzer now with the ADC clock set for 192k samples/sec, which is the maximum for this spectrum analyzer. Once I get out past 20 kHz USB power issues show up, perhaps also from the D10. Without proof, assume this is the QA401.
The second harmonic is at 80kHz and is down 88dB but again this could be the spectrum analyzer’s residual distortion, not the Topping. It is amazing that this full-scale 40kHz signal has a first harmonic distortion spur at 0.004%
The -20dB attenuator and change in sampling rate moves the noise floor up. The accurate noise floor levels, with FFT processing gain, are shown in the first three spectra in the measurement sections with the QA401 analyzer at 48k samples/sec. I did not need the attenuator with the signal level at -50mVRMS or less.
Using a 192k samples/sec .wav file of an 80kHz signal, at 0dBFS, the Topping produces an 80 kHz tone in figure 11.

Again the graph is dBr with 0dBr at 2VRMS. You can again see some spurs likely to be from the spectrum analyzer, not the Topping D10. The spectrum analyzer is again using the Flat Top window. The amplitude of the signal is 1.88VRMS which is down 0.5dB at 80kHz. This is amazing for $90.
You need to invite a bat over to your house to listen to a DXD recording of Johann Strauss II – Die Fledermaus (The Bat, although it is sometimes called The Revenge of the Bat) to assess your system’s quality. As far as I know, the only high-resolution recording is Lawrence Foster and the NDR Radiophilharmonie at 96k samples/sec so the bat will complain of a missing high end.
A 1 kHz square wave at -20 dBFS sampled at 48k samples/sec is shown in the time domain in Figure 13

This oscilloscope screen scrape shows that the D10 reconstruction filter is a linear phase FIR. It has excellent stopband rejection, as we will show below.
In figure 14, I pushed the sample rate up to 96k samples/sec and kept the square wave the same.

Changing the sampling rate of the 1kHz square wave to 96k samples/sec yields the expected result of shortened Gibbs pre and post ringing.
Figure 15 shows the stopband rejection at a sampling rate of 48 kHz.

This test was done with the Audacity tool generating white noise at -20 dBFS. This technique was developed by Jurgen Reis of MBL. John Atkinson first applied it in his test reports and it has spread widely since then. Although no signal information exists above 24 kHz when sampled at 48k samples/sec the noise is aliased and the reflected noise traces out the frequency response of the reconstruction filter. I would never have expected this but Jurgen Reis showed us how to do it
I adjusted the noise level to try and get the filters stopband rejection above the QA401s noise floor, but I did not want to take the noise too high or the ADC in the QA401 could get unhappy about the signal level and move its noise floor up. In the end, I went with -20dB down. You can see the stopband is -90dB down in this spectrum starting at 26kHz. That is very good for a lower cost DAC but I do not have the specs for this ESS DAC. The rejection of the digital filter could be greater and the spectrum analyzer is limiting me.
Note the passband extends to 22kHz. I marked the passband to stopband transition on the figure.
I changed the sampling rate of the noise to 96k samples/sec in Figure 16.

You can see the DAC reconstruction filter response, using the Jurgen Reis test, has doubled.
The passband extends to 45k. The stopband is again down at least 90dB starting at 52kHz. I expect the passband to stopband ratio to be the same as the 48kHz result and that is what I measured.
Finally, I changed the sampling rate of the noise to 192 k samples/sec in Figure 17 and repeated the Jurgen Reis test.

You can see it is flat past 85kHz. Some of the roll-off above 85kHz is the ADC in the QA401 spectrum analyzer which is also running at 192k samples/sec. Since I can only sample at 192k samples/sec maximum with the QA401 I could not observe the stopband. Any doubt about the Windows 10 driver being high resolution is dispelled by the result above coupled with the measurements that preceded this.
The final spectrum is the Julian Dunn J-Test for jitter at a sampling rate of 44.1k samples / sec. This test is now available from the signal generator included in REW software. I saved the file and played it back with Foobar. The test is close to an 11kHz tone –3dB down and a small, low frequency square wave which creates activity in the PCM data that makes it harder for the clock recovery circuit to produce a clock without some phase noise.

I used a 16-bit test with REW introducing the square wave at an amplitude of the smallest level possible for 16-bit data which is called the least significant bit. An excellent explanation of the J-Test and the spurs the test produces can be found at this link
John Atkinson identifies the spurs amplitude and frequency of the J-Test in absence of jitter. John then comes up with an innovative line to be placed on a spectrum of the analog output of a DAC box which is reproducing the J-Test. Any spur below the line is inherent in the test and not from the DAC box.
The D10 spurs are, at the most, 3dB above the line. Note the analyzer is set to dBr so you can read the Jitter level following the procedure of Atkinson. The small noise enhancement at 670Hz below and above the 11kHz tone was present for a sine wave without the square wave added in J-Test. This is likely the spectrum analyzer. The 14.4KHz spur also show up with an 11kHz tone alone. It is again likely the spectrum analyzer.
The net result is the Topping D10’s 16-bit J-Test jitter results again show it performs like a much more expensive product.
My first DAC?!?
I am into classical music only. At least in classical, compressed mp3 streaming is dreadful. Published double-blind tests confirm mp3 is not transparent. I have trained to identify compression artifacts quickly.
In my opinion, lossless streaming sites are as useless to serious classical listeners as the lossy ones. See this New York Times article.
Since I did not stream music in the past, I had no need for a USB DAC. I would connect my hard drive with music files to an audio component that can decode them directly and send them via HDMI to my AVR with room correction. The little Sony BDPS6700 BluRay player I reviewed does that.
The discontinued Oppos and many AVRs also play files off hard drives. I still like this better than streaming. I own the recordings. They are not going to disappear when a streaming site gets into a licensing issue with a label. You do need a TV. I use a 19 inch since I do not want a big reflective panel in my listening room.
Two lossless streaming sites, just for classical listeners, have now become available as the New York Times article above reports. I will be testing these for you here at Secrets. To do that article I need a streaming USB to SPDIF converter so I could use my older pre/pro which does not have a USB input. The Topping D10, being the cheapest with the FCC and CE certifications, fits the bill.
Once the Topping D10 got shipped from Amazon I could not resist putting the unit on the test bench to see what the analog outputs looked like which grew into this review you have just read.
The Subjective Test
I did none since I did not purchase it to listen to its analog output but instead the digital SPDIF outputs. The measurements should speak to the quality of the unit alone in my full bench test above.
Many products will perform worse than the TOPPING D10 at 10X the price. The Topping D10 re-defines “value for the money” in regards to DACs.
- Amazing build quality and performance for the price and indeed 10X the price. We have seen equipment with internal DACs fail to do what the D10 does at 10X the price and in some specs more than that.
- Topping is a real company; the built quality is excellent; FCC and CE certification has been achieved. The products are sold by mainstream dealers with strong track records for customer service, not some unknown 3rd party Amazon supplier or someone on eBay.
- None and that is without the company’s custom drivers installed. Some higher-priced units have more informative displays like bit depth of the source but this is nitpicking.
If you have only $90 to spend, the Topping D10 will give you close to state-of-the-art performance.