DVD Benchmark - Part 2 - Audio
September, 2000
(Updated March, 2005)

Colin Miller
Background
There's the old audiophile myth that measurements don't mean anything because something can measure the same, yet sound vastly different. If you take the specs provided by most manufacturers as measurements, I'd say that it's true that those numbers don't mean a whole lot, and can seem pretty similar with very different performance differences. However, those aren't what we'd consider useable measurements. If carefully done, precise audio measurements can reveal vast differences in audio performance resulting from tangible differences in build quality and design. Some would argue that modern equipment can measure differences far beyond the threshold of human hearing. While I think that's true in an objective sense, keep in mind that interpreting those differences, be they subjective or objective, still requires a human factor. A machine can very precisely tell you quantitative information about an audio signal, but it can't tell you what that signal will necessarily mean to any given individual who hears it reproduced.
Results of all our Benchmark Tests are located HERE.
Audio Measurements
We used a lot of tests we did last year, with the Audio Precision System Two, changed some tests, added new tests, and left out some tests. Overall, I think our testing provided more useful information, though given more time, I would have liked to have expanded the testing procedures, and modified some of the existing ones.
Specifically, we tested
Full-Scale Output Levels (Left, Right, and Difference).
Frequency Response.
Wide-Band Noise Spectrum FFT (with Laboratory Grade AC Supply).
Wide-Band Noise Spectrum FFT (with standard “dirty” wall socket AC Supply).
THD+N Spectrum FFT.
THD+N vs. Frequency.
IM Distortion.
Dynamic Range.
20 kHz “Stress” Test.
Full-Scale Output Levels
At first, I thought this a not so useful test, as the absolute output is not a direct indicator of sound quality, but rather simply relative volume. After considering it, though, I changed my mind, for a few reasons.
First, when comparing the analog outputs of players back to back, differences in playback volume can be easily confused with differences in subjective playback quality. In many tests, people have expressed a preference for playback in terms of quality in which the only difference was volume. A few audio gimmicks (HDCD, DTS, or Vacuum Tube “Buffer” stage upgrades for example) take advantage of that. So, knowing what the relative output level is in absolute terms can indeed be a useful thing when comparing different players.
Secondly, with a given noise floor inherent in a particular audio system, a particularly low output from the original source can result in lower dynamic range, which in linear systems, translates to low-level resolution. Following this low output with a gain stage does not improve the situation, as the gain applied to the signal also amplifies the noise floor, so that the dynamic range remains the same, possibly worsened by the noise of the device providing the gain. In other words, if the playback level is lower, and the noise floor is the same, even when the volume is equalized, the resulting noise floor is higher. That's not to say that lower output means necessarily lower dynamic range, and therefore less low-level resolution, but it can be useful to note the output level when analyzing the dynamic range performance of a particular player to see if it had any possible effect.
Thirdly, comparing the output of the left vs. right channels gives us some idea of what kind of manufacturing tolerances we're looking at, indicating some degree of build quality. While the difference would have to be quite substantial to actually throw off the subjective soundstage, it would be difficult not to argue that all things being equal, a closer match is better, if only for peace of mind.
Frequency Response
Human ears are very sensitive to tonality, sometimes in ways we wouldn't suppose. Frequency response determines the tonal character, if any, imposed by an audio component. If the output at any given frequency across the audible range is not equal in proportion to that output at any other frequency, it will not only alter the proportions of sounds occupying different frequency ranges, but the proportions of harmonics, the spectrum of which helps us identify the nature of a given sound, helping differentiate a flute from a violin.
With today's digital audio standard used by CD, frequency response should be very good, with a very minor taper at the upper-end of the frequency range before 20 kHz due to the constraints placed on the required analog filter by the 44.1 kHz sampling rate. With DVD-A and SACD players, frequency response should be excellent.
Compared to last year, in 2001 we did frequency response measurements with a continuous sweep, as opposed to sampled points, which allowed a more precise picture of a player's performance.
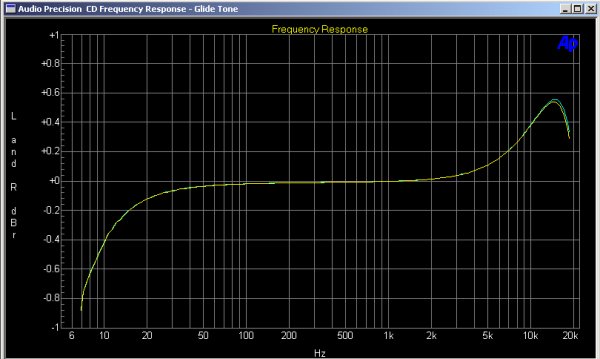
Good Frequency Response
This picture shows a very good frequency response. Not only does it imply tonal accuracy, but it also implies a nicely designed and implemented reconstruction filter, without ringing or ripple.
Poor Frequency Response
Above is a really bad frequency response in terms of the high-frequency deviation, for electronics at least.
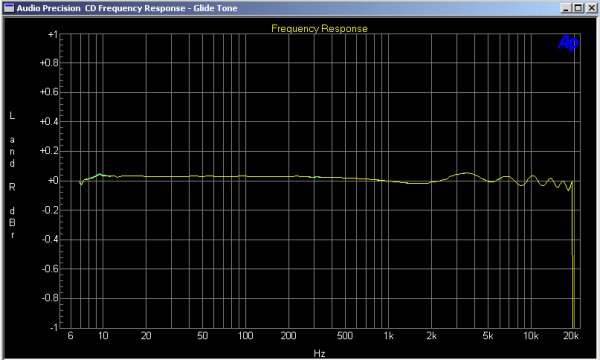
Poor Frequency Response Example 2
Another example of a poor frequency response shows not so much absolute deviation from flat, but rather a lot of ripple in the top-end. The tonal deviation itself might not be so audible, but it also implies ringing, caused by a poorly designed reconstruction filter.
A reconstruction filter is supposed to remove as much high-frequency garbage from the signal (called “images,” generated from the discrete “steps” created by the D/A converters) as possible, while affecting the band below the Nyquist frequency as little as possible. This isn't an easy thing, and while some filters may substantially attenuate the higher-frequency output as a side-effect, others generate this “ripple.” Consequences of ripple are not only the variance in frequency response, but “ringing” which causes delays and excessive phase shifts. Needless to say, ripple is undesired, and in my opinion, less desirable than a gradual, controlled roll-off.
Wideband Noise Spectrum FFT
One of the greatest benefits of high-bit digital audio, other than low distortion, is a potentially low noise floor, and subsequently a fantastic dynamic range, allowing anything from a tipple to an avalanche on a dime of time. Not only does the recording medium allow great contrasts in output to convey contrasts in a performance, but that potentially low noise floor and relatively instantaneous dynamic range allows the low-level detail and nuance in the midst of a waterfall, or rather mist in a waterfall, if you'll excuse the metaphor. However, all of our nifty technology is for nothing if the noise floor inherent to the analog portion limits the potential of the medium.
Feeding a "Zero Infinity" bit-stream to the D/A converters instructs them to produce theoretically perfect silence (in essence muting them). While doing this, the Audio Precision did an FFT (standing for Fast Fourier Transform, or a mathematically derived spectrum analysis) of the player's output, which reflects the noise floor of the analog outputs, plotting amplitude as a function of frequency. This shows the effects of the power supply and internal electronic environment's effect on those analog outputs. Regardless of the quality of the D/A converters, this noise spectrum will ultimately limit the overall performance of the player. Single-bit converters may actually still contribute to the noise floor, even when “off,” as they require a great deal of switching to simply produce silence, so that the contents of the higher frequency spectrum of the noise floor may show the effectiveness of their filters in that case.
Using the Audio Precision's capability to do FFTs, we did the same test twice under two different circumstances: once with a standard AC wall socket, and again with a laboratory grade AC regenerator (The PS Audio Power Plant). The purpose in doing the test twice under different circumstances was to determine how much and what part of the noise was due to poor AC noise filtering in the power supply, and what was inherent to the player, regardless of AC power conditioning, due to miserably regulated power supplies, poor circuit layout, noisy electronics, or in the case of single-bit DAC's, poor filtering. Then, we could identify players that would benefit most from cleaner AC, those which either had very solid power line noise rejection by themselves, and those that were just inherently noisy themselves, without hope in either scenario. We found a wide range of variation in results.
Good Wideband Noise Spectrum FFT
While this isn't as pretty as I would ultimately have liked, in terms of flatness, in that you can see the main AC components at 60 Hz, 300 Hz, and slightly upward, and that there is a little ultrasonic trash on the top end, for the most part, the noise floor is very well behaved. To be fair, though, most of the “peaks” are far below –120 dB, and that no single group really dominates, so as to become more easily identified.
Poor Wideband Noise Spectrum FFT
This noise floor exhibits substantial AC components at 180 Hz and 300 Hz, as well as an average noise floor that hovers substantially higher. In addition, it seems that the entire noise floor seems to rise beyond the audible range. While the noise floor of this component may blow away the performance of a cassette tape or LP, it was one of the poorer examples of the group.
Harmonic Distortion + Noise FFT
Harmonic distortion does not always make a subjectively negative contribution, but changes the perceived character of a sound, adding harmonics not only to the original fundamental, but the original harmonics as well, generating harmonic character, and subsequently obscuring the original content. It may make the sound bright, harsh, and gritty, or it may sweeten and otherwise pleasantly texturize. While that may provide an enjoyable experience for some, for the purposes any real sense of fidelity, this is always detrimental, though the nature and degree of the coloration will of course vary from component to component.
While the commonly used single THD+N specification provides the absolute level of harmonic distortion and any other noise lumped together by simply applying a notch filter to the test tone frequency, and measuring everything left, this does not allow an examination of the distortion components by themselves, separated from residual noise. In terms of applying the measurements of distortion to audible effects, it is important to know not only the magnitude of distortion products in relation to the noise floor, but also in relation to each other (i.e., the relation of higher vs. lower order distortion).
By using DSP to do an FFT that analyzes the leftover signal after the test tone has been notched out, the computer-based Audio Precision Two can divide the distortion and noise output based on frequency content, which allows the user to inspect the results in a more meaningful manner, showing the distortion products distinctly where they rise above the noise floor, and how those distortion products compare between each other. Sound useful? Very!
Good Harmonic Distortion + Noise FFT
A Good Distortion spectrum not only shows very little distortion in an absolute sense, but also shows a distortion spectrum in which the lower-order harmonics (2nd and 3rd, for example) are more dominant than higher-order harmonics (6th and 7th, for instance.) While the ideal reproduction creates no harmonics, lower-order harmonics are less audible to humans because of a phenomenon known as “masking.” That is, harmonics closer to the original fundamental are more difficult to discern, and the farther those harmonics get from the fundamental, or the higher-order they are, they easier they are to hear. Some people also consider lower-order distortion as more pleasant, as opposed to finding higher-order harmonics “harsh.” It may even be that excessive lower-order distortion, though coloring the harmonic texture of the sound, may act to mask higher-order distortion, making the sound subjectively cleaner to some listeners. I would like to note, though, that despite the myth that solid-state electronics exhibit higher-order distortion than their tube-based counterparts, I have personally enjoyed subjectively, and measured, solid-state components which had not only relatively little distortion in an absolute sense, but absolutely no higher-order distortion products at all, evidence that you can indeed have your cake and eat it too.
Poor Harmonic Distortion + Noise FFT
Without cake or frosting, while the absolute level of distortion in most modern electronics isn't exceptionally high, it seems that more than a few manufacturers haven't caught on to the importance of the shape of the distortion spectrum, or rather have buried it. While manufacturers can do things such as abuse Negative Feedback (I must mention that Negative Feedback, properly applied, is a very good thing) for the sake of making impressive specs, this, or other design parameters, can lead to a distortion spectrum which exhibits substantial higher-order distortion, distortion that is easier to discern, and to some people, very objectionable. The player shown above exhibited substantial amounts of distortion in 5th and 7th harmonics before finally settling down. Note that the content just below 16 kHz is not harmonic distortion, but rather some spurious noise generated by some other mechanism, which happens to appear in one of the channels, but not in both.
THD+N vs. Frequency
While our THD+N FFT test gives us a very good look at the distortion properties of a component at a single frequency, it only gives us a glimpse at that particular frequency. In our test, we chose the standard 1 kHz as our default test tone, as it represents a range where the fundamental and harmonics fall into a range easily heard by humans. Besides, the 1 kHz test tone is somewhat of a standard. However, some components will exhibit wildly differing performances at different frequencies. Although the THD+N vs. Frequency plot doesn't give us so much detail as to the nature of the noise spectrum, it can show us how the general performance changes with frequency, and can indicate where we should seek further testing.
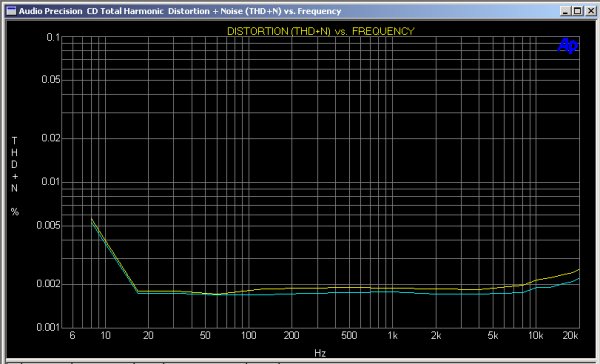
Good THD+N vs. Frequency
What we want to see is a plot that is not only low, but also relatively flat, implying that what we saw at 1 kHz is probably representative of most of the audio range. Due to the realities of electronics, you will normally see a little rise at the high-frequency side, as Negative Feedback loops should back off where they're not fast enough to act responsibly, but for the most part, well-designed components should be fairly consistent in their distortion and noise products across the audible band.
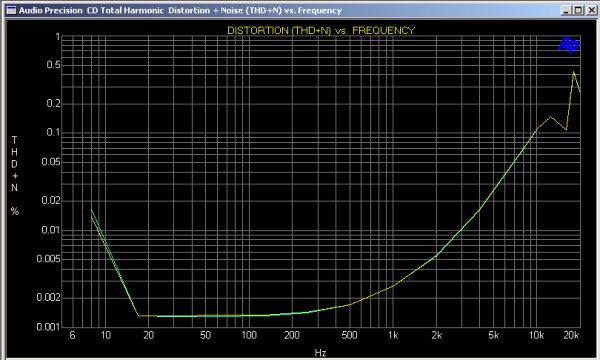
Poor THD+N vs. Frequency
When you see a plot that's fairly uneven, like above, it gives cause for concern, and probably indicates that the 1 kHz THD+N FFT might not represent as complete a picture as we'd have hoped for. In our measurements, we encountered a few players that indicated that multiple tests were prudent. This example is actually not so bad as if there were a peak at, say 400 Hz, where possible higher-order harmonic content would fall in the most sensitive range of human hearing, around 2 kHz.
IM Distortion
Last year, our IM distortion test was simply a severe lemon test. When using the SMPTE standard tones of 60 Hz and 7 kHz, all the players did very well. This year (2001), we made it harder, using tones at 11 kHz and 12 kHz. With tones more closely spaced, differences in players became more pronounced. This test is important because real audio material contains many multiples of tones, which provide for the possibility of distortion which a single-tone test wouldn't catch.
What IM distortion means is that, when two frequencies are present in the music, the hi-fi component not only delivers those two tones but other frequencies that are the result of adding the difference between the two to the original frequencies, and subtracting the difference between the two from the original frequencies. So, with 11 kHz and 12 kHz originals, the difference is 1 kHz, and the IM spectrum would show frequency peaks at 13 kHz, 14 kHz, 15 kHz, 16 kHz, etc., and at 10 kHz, 9 kHz, 8 kHz, 7 kHz, etc. The peak at 13 kHz is the result of adding 1 kHz to the 12 kHz original. The 10 kHz peak is the result of subtracting 1 kHz from the 11 kHz original. The 14 kHz peak is from adding 1 kHz (the difference between the 12 kHz original and the 13 kHz IM peak) to 13 kHz. The 9 kHz peak comes from subtracting 1 kHz (the difference between the 11 kHz original and 10 kHz IM peak) from 10 kHz. So, you can see how much of a mess that just two original frequencies can create when there is IM distortion. The larger these additional peaks are, the higher the IM distortion. Just imagine how much mid-range congestion there is when a large number of frequencies are present in the original music, and the IM distortion is high.
Good IM Distortion
When the IM distortion properties are good, what you get when you combine 11 kHz and 12 kHz within the audible band is only 11 kHz and 12 kHz.
Poor IM Distortion
When IM distortion performance isn't so good, 11 kHz and 12 kHz results not only in those original tones, but new tones skirting the original tones at intervals equal to the difference of the original tones as well.
Dynamic Range
Dynamic range is usually thought of as the ability to play at high output levels. While this is one side of the equation, the other necessary requirement for a wide dynamic range is the ability to play at low output levels too. This means that noise inherent to the system's whole operation allows meaningful resolution at low levels. In a linear encoding scheme, such as PCM (Pulse Code Modulation), or DSD (which is really not that different than PCM except that it uses a higher-sampling-range, a single-bit, and a lot of noise shaping to do the same job,) dynamic range directly translates into resolution.
While the wide-band noise spectrum tests the noise content with the D/A converters muted, the Dynamic Range test runs the D/A converters at a moderately low level (-60dB from full-scale), and then notches the test frequency and looks at the remaining noise level which includes not only the background noise content of the analog output stages, but the noise level of the D/A converters themselves. Last year we used a 16-bit test-tone, in which most, but not all players, achieved or nearly met the 96 dB dynamic range potential of the medium. This year, we used a 24-bit tone running at a 96 kHz sampling rate to really let the players open up, and greater differences emerged, which were very interesting, given the touting of high-quality DAC sections of many that fell quite short of 24-bit dynamic range. Our test results in this situation ranged from 90 dB (equivalent to 15-bits of actual performance) to 106 dB (equivalent to almost 18-bits of actual performance.) I should note that while we tend to get caught up easily in how many bits of digital word length, considering 24 bit converters to be pretty much the norm, if you can actually get a real 20-bits of resolution out of the best equipment, you're doing pretty darn well. While none of the players actually achieved 20-bit resolution, considering that the audio section of most of them was an afterthought to video performance and software, 18-bits aren't bad, and still exceed the performance limits of standard CD easily.
20 kHz “Stress” Test
Well, we kind of made this one up. 20 kHz isn't present in most musical or soundtrack content, but it is difficult for many players to reproduce, as it borders on their limits of reproduction given a 44.1 kHz source. It's even less likely that your player will ever have to reproduce 20 kHz full-scale. Still, it seemed difficult for many players to do, so I chose to adopt it. Effects of poor reconstruction filters, jitter, and noise shaping techniques will arise under this test, manifesting as content both below and above the original tone. While interpreting exactly what causes what is difficult, it is easy to see in the FFT that some players do this well…
Good 20 kHz “Stress” Test
While you can see that the performance isn't perfect, with a small amount of peaking, notice the alternative below.
And others do not . . . .
Poor 20 kHz “Stress” Test
While the trash above the 20 kHz limit is ugly, the substantial content below is more worrying, with spikes as low as 4 kHz. If I were to venture a guess, I'd say that this might be due to jitter-related modulation. Next year, we'll modify this test to display results in a linear-fashion, which more easily shows the symmetrical modulation effects. By the time I got the idea to rerun the tests this way, time was up.
Conclusion
Although it was a lot of work, I really enjoyed banging around with all of the players, and discovering how different the electronics really are from an objective standpoint. However, considering that I've still yet to recover from the sleep deprivation, I can truthfully say that next year can wait at least a few more months.
- Colin Miller -
Bibliography:
EIA Standard for testing CD Players - http://www.uni-scope.com/articles/stand.html
DVD Benchmark - Technical Article Index
Part 1 - Video Part 2 - Audio Part 3 - Functionality Part 4 - Usability Part 5 - Progressive Scan Part 6 - DVD Audio

© Copyright 2000 and 2001 Secrets of Home Theater & High Fidelity
Return to Table of Contents for this Issue.


Magazine Publishing Solutions by