Output Compression Test
As playback level is increased, any subwoofer will
eventually reach its linear output limits. These limits are usually first
reached at the deepest frequencies. This phenomenon is known as output
compression, and can be caused by exceeding the thermal, mechanical, or port
flow limits of the subwoofer. Output compression can also be caused by
amplifier limiter circuits engaging to prevent subwoofer overload.
The goal of this test is to determine how loud the subwoofer can play before
its frequency response becomes non-linear. It is also useful to assess the
extent and severity of the compression at progressively higher sweep levels.
A subwoofer which remains compression-free at loud sweep levels will sound
powerful and dynamic on demanding music and DVD passages. Conversely, a
subwoofer which exhibits significant compression will have poor dynamics at
high playback levels, with the deepest passages lacking power and impact
relative to the mid-bass passages.
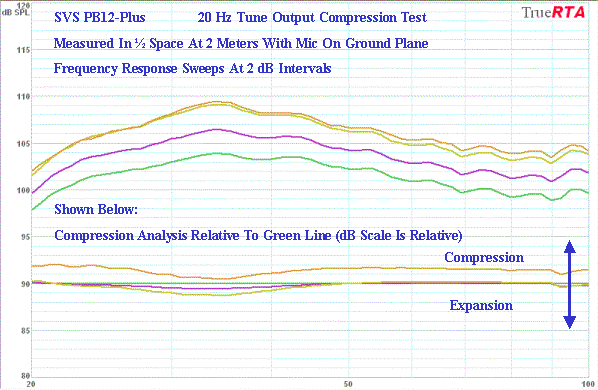
Output compression was evaluated with a 45 second logarithmic reverse sine
sweep from 100 Hz-10 Hz. Sweeps were conducted at progressively louder (2
dB) increments. The graphs below show each sweep, and there is also a
compression analysis included which indicates the relative amount of
compression or expansion.
The PB12-Plus (20 Hz tune) frequency response remained linear (uncompressed)
up to the green curve. The next two sweeps (purple and yellow) actually
showed expansion (i.e., a non-linear increase in sound pressure) between 30
Hz and 40 Hz, but no compression. The highest sweep level (orange) shows
uniform compression across almost the entire pass band, suggesting an amp
limiter engaging.
The PB12-Plus would not play any louder than the orange sweep level, so I
terminated the test at that point. Regardless, the 101.5 dB output level
(yellow sweep) at
20 Hz is the highest output I have yet measured from a single-driver
subwoofer in this test.

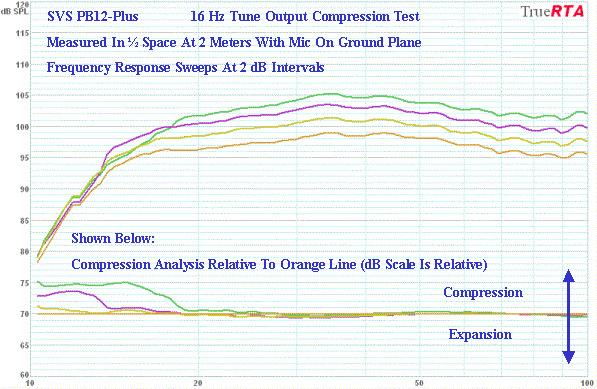
As shown below, the PB12-Plus (16 Hz tune) frequency response remained
linear (uncompressed) up to the orange curve. The next higher curves (yellow
and purple) remained almost compression-free down to about 14 Hz, with the
purple curve posting an impressive 99 dB at 16 Hz. The green curve showed
more significant compression starting below 19 Hz (likely the amp limiter
engaging).
While overall output is more sedate than the 20 Hz tune, the PB12-Plus still
retains high output capability across the pass band in the 16 Hz tune, while
extending considerably deeper. The uncompressed output of 99 dB -100 dB in the
16 Hz - 18 Hz region (purple curve) is again the highest I have yet measured from
a single-driver subwoofer in this test.

Total Harmonic Distortion (THD) Test
Harmonic distortion occurs when
multiples of the fundamental signal are produced by the woofer due to
non-linear (electromotive or mechanical) driver behavior. Most woofers will
exhibit fairly linear output behavior up to about 10% THD. If the woofer is
pushed much past 10% THD, it will quickly become non-linear, with small
increases in sound pressure resulting in disproportionately large increases
in distortion.
The audibility of distortion is affected by the perceived loudness of the
distortion harmonics relative to the fundamental, and the presence of any
other masking sounds in the source material. Also, odd-order distortion
harmonics are musically dissonant, and are usually perceived as more
objectionable for this reason. While there is debate over distortion
audibility thresholds, my own experience indicates that THD exceeding 10%
will cause audible doubling, a loss of clarity, and noticeable pitch
shifting during normal music and movie playback.
For the aforementioned reasons, I use a 10% THD limit for this test. The
goal is to measure the 10% THD-limited sound pressure at various test
frequencies, and also to assess the linearity of this performance across the
entire pass band. A subwoofer which scores high in both categories will
sound clean and distinct at all bass frequencies (especially the deepest
ones) even at loud playback volumes. Conversely, a subwoofer which scores
lower in one (or both) categories will start to produce audible distortion
harmonics, particularly at the deepest frequencies, as the playback level is
increased.
As shown in the table below, the PB12-Plus can play very loud across the
entire pass band before distortion reaches 10%. At some mid-bass test
frequencies, the output was capped by the amplifier limiter before
distortion reached 10%. Output dropped off quickly below each rated tune
frequency, and this is normal behavior for a bass reflex subwoofer. This
drop-off is further exacerbated by the high pass filter, which is designed
to reduce output below the tuning frequency to help protect the woofer from
over-excursion.
The 20 Hz tune has 2 dB - 4 dB more clean output available in the 22 Hz - 32 Hz
bandwidth as compared to the 16 Hz tune. A 2 dB -4 dB output advantage in this
region will definitely be noticeable when pushing the subwoofer near its
limits, and I recommend the 20 Hz tune for aggressive playback levels,
especially in larger rooms. In comparison, the 16 Hz tune has a large output
advantage in the 14 Hz - 18 Hz bandwidth, without losing too much ground (as
compared to the 20 Hz tune) at higher bass frequencies. Accordingly, I
recommend the 16 Hz tune in mid-size rooms for all but the most extreme
playback levels, and it will provide an excellent combination of ultra deep
extension and strong output.
|
Frequency (Hz) |
20 Hz Tune
SPL (dB) |
20 Hz Tune
THD (%) |
16 Hz Tune
SPL (dB) |
16
Hz Tune
THD (%) |
| 14 |
- |
- |
82.7 |
10.3 |
| 16 |
- |
- |
95.0 |
10.0 |
| 18 |
91.1 |
10.2 |
99.4 |
6.8* |
| 20 |
101.3 |
10.4 |
100.9 |
9.2* |
| 22 |
104.0 |
3.7* |
99.9 |
10.4 |
| 25 |
105.8 |
6.4* |
101.9 |
10.3 |
| 32 |
108.4 |
8.5* |
106.7 |
9.9 |
| 40 |
108.5 |
4.5* |
107.3 |
4.7* |
| 50 |
107.2 |
3.8* |
106.7 |
4.6* |
| 63 |
106.0 |
3.6* |
106.1 |
4.8* |
| 80 |
104.2 |
4.0* |
104.5 |
4.9* |
* output was capped by the amplifier limiter before THD reached 10%
Output linearity (with respect to the 10% THD limits shown above) is
calculated by dividing the average SPL by the maximum SPL, and expressing
the result as a percentage. A score of 100% means the subwoofer exhibits
perfect output linearity (with respect to the 10% THD limits) across a given
bandwidth. As shown in the table below, the PB12-Plus delivers loud average
sound pressure levels, and has excellent scores in both the 20 Hz and the 16
Hz tunes.
| Bandwidth (Hz) |
20 Hz Tune Average SPL
(dB) |
20 Hz Tune Bandwidth
Linearity |
16
Hz Tune Average SPL (dB) |
16 Hz Tune Bandwidth Linearity |
| 14-80 |
- |
|
101.0 |
94% |
| 16-80 |
- |
|
102.8 |
96% |
| 18-80 |
104.1 |
96% |
103.7 |
97% |
| 20-80 |
105.7 |
97% |
104.3 |
97% |
| 22-80 |
106.3 |
98% |
104.7 |
98% |
| 25-80 |
106.7 |
98% |
105.5 |
98% |
Click Here to Go to Part IV.