

Introduction to the Anthem Room Correction ARC System – Part I
Among the numerous room correction systems (automatically adjusts speaker delay, frequency response, and loudness, with respect to the listening position) I have tested, the Anthem ARC currently stands out as the best for consumers. This section outlines the product’s distinctive competencies. To keep things simple I am going to use the term AVR exclusively. The Pre/Pro is an AVR without a power amp although the absence of the power amp may allow the Pre/Pro designer the space to extend performance. For example the number of DSP chips (programmable and application specific) may be increased.
ANTHEM ROOM CORRECTION ARC SYSTEM-PART 1 SPECIFICATIONS
- Anthem Room Correction (ARC)
- Software Version 3.01, Calibrated USB Microphone, Microphone Stand
- ARC is included in all Anthem and Anthem Statement AVRs (A/V Receivers) and Pre/Pros (A/V Processors)
- Note: The PC Software and microphone are included with all Anthem AVRs and Pre/Pros down to the $1,000 MRX 300 AVR.
- Subwoofer version called PBK is $100 (not tested). PBK works on most Paradigm subwoofers. Look at the Paradigm website for subwoofers that have a USB port for PBK equalization.
- PBK subwoofers are not required for Anthem AVRs and Pre/Pros which have the same subwoofer correction algorithms. Multiple subwoofer deployments may benefit with PBK and ARC (not tested).
- Anthem
- Paradigm
- SECRETS Tags: anthem, system, audio
Room correction occurs in three steps:
- Measure the room’s response to test stimuli sent to the speaker
- Fit the digital filter coefficients for room correction
- Perform room correction in real-time with a digital signal processor in the AVR.
Step 2 heavily influences the quality of outcomes. Not surprisingly, these algorithms often consume 90% of the development time of the best products.
Computing the model’s coefficients has typically fallen to a DSP chip on board the AVR. The DSP is designed for real-time signal processing, making it ideal for the signal processing aspect of this application (Step 3). The DSP, however, falls short when tasked with off-line computations (Step 2). To circumvent this issue, room-correction algorithms are often deliberately simplified, thereby sacrificing the quality of the model’s parameters for the sake of compute speed.
A PC is better suited to calculate the model’s coefficients. The filter computations are completed on your computer from files of measurement data. This is a huge advantage over systems that use the DSP chip inside the AVR. As algorithms are improved all that is required is a software update. Moving to a PC provides another advantage; namely, the PC display is the user interface. The AVR’s on-screen display cannot provide 1% of the information and cannot store data from previous runs to compare differences.
For example, the PC can display the Anthem ARC frequency response data (before and after correction). Numerous customization options may be available on an advanced room correction system. As the options are changed in the configuration panel the post equalization frequency response graph also changes to show the effect. Navigating complex options on a GUI from the AVR to the TV screen becomes impossible and how a change affected the final acoustical response of the system is impossible to determine.
The Avantages of a USB Mcrophone
The PC must capture the in-coming signals to the microphone. This has been problematic in the past because the microphone needs a preamp, and the analog signal must be converted to digital with an external ADC (the sound card in a laptop is not up to the task). Since the listening seat may not be proximate to the PC, it is typical to use a microphone connected to the receiver, but this comes at a price. In many cases, the hardware is sold separately, costing hundreds of dollars. Anthem provides a USB microphone, making practical consumer-based PC-based room correction. The need for analog microphone cables, external microphone preamps, and ADCs is eliminated. The microphone preamp, ADC, and USB drivers are internal to the microphone. There is no corruption by electromagnetic coupling from power lines or other sources, because the USB cable sends the digital data.
The quality of the microphone is critical for a high quality result. Any error in the microphone’s response will appear as an inverse error in the corrected response. If the microphone rolls-off at high frequencies, the room correction system will think the speakers are rolled off and will apply a boost at the top end. A microphone calibration curve has the inverse of the microphone error superimposed.
All professional quality room correction systems use calibrated microphones. In a test chamber, the microphone’s response is measured. A table is made that captures the microphone’s error. The microphone then ships with the error table data. This error table is entered into the PC so the room correction system is calibrated to produce a flat frequency response from the microphone. Despite the low starting price Anthem supplies a calibrated microphone with the calibration file for all products. Just saying a microphone is calibrated is not enough. The number of frequencies that the microphone is calibrated at is as critical as the procedure used to do the calibration.
I have seen a couple of products (room EQs and measurement systems) claiming a calibrated microphone, but the data file for each microphone is not supplied, and these systems cannot deal with such a file, even if available. In these situations, the calibration these companies refer to is an average error for all the microphones they ship. The variations in individual microphones is too great for this be effective. Look closely at any product’s claims. You may need to download the user’s manual to verify that no calibration file is supplied.
As you work your way through this review, you will see corrected plots showing the Anthem Room Correction (we will use the acronym ARC for the remainder of the review), and that the correction falls within an error bar of +/- 1.5dB. Some of this is not even ARC, but from my errors from my own calibrated measurement microphone and small differences in microphone placement.
The Consumer at the Controls
Anthem is not the only AVR provider to use a PC for calculating filter coefficients. However, access to the PC software had been the sole domain of third-party installers. They bring the microphone and PC, and run the calibration. Once they are done, they take the microphone and PC away and send you a bill. The installer must return if the speakers or seats are moved, and you pay another fee.
With installer-based EQ systems, you do not get to change the parameters. The installer quickly picks what he thinks sounds best and exits the picture. Perhaps the installer may allow you to listen to the system and make quick comments on problems. This all happens in such a compressed time frame as to limit homeowner options. The finished product might have been satisfactory for the installer, but subjectively inadequate for the homeowner.
Anthem has broken this model, offering its best PC software on all products in the box. The calibrated USB microphone makes PC-based room correction by the consumer practical. With the program in the hands of the consumer, there is more time to listen and adjust in an iterative fashion.
Anthem uniquely takes advantage of the PC to permit the user to optimize speaker placement and listening position. A real-time display of the room response updates continuously. One seeks to minimize response variations before correction by moving the seat and speakers to achieve better post-correction results. Normally you would need special equipment to do this.
Anthem calls this the Quick Measure mode. A screen shot below shows the change in response as the speaker is moved.

Since the Quick Measure display only shows changes as they occur for about a minute before removing the oldest curve, only small response changes can be seen in the screen shot. To fully appreciate Quick Measure you need to see it in action live.
The one response curve the Anthem ARC system cannot display is the verification of the complete system response with a subwoofer. The ARC PC display can tell you if the subwoofer and main-channel speakers are correctly equalized, but it cannot display what happens in the range when both are playing together at the crossover. To do this you must have an external acoustics measurements system. In Part II of this review, I will show how well the ARC system does with a subwoofer deployed as part of the system.
ARC offers a variety of control options in a few control panels. I will present the relevant control panel setting at the appropriate time in the review. ARC provides a basic operating mode that automatically sets the panels. This is a good option to use when you first use the system. That process involves only positioning the microphones and downloading the results.
Later you can start to use the advanced settings. Nobody is rushing you. You can try one advanced setting and see how it changes the sound of the system. In some cases, the parameter you select is dependent on how you want your system to sound, so you need to set the parameters in an repetitive process in which you listen to your system with a parameter change and then listen again with the parameter at a different value. This will allow you to make real improvements in your system over time.
Advantages of a PC-based System for System Design
As algorithms are improved, all that is required is a software update. Updates to room correction systems that compute coefficients inside the AVR are rare. In fact, a manufacturer might not be able to make an update at all, even if a problem is identified. The memory containing the instructions for the DSP often cannot be changed externally. Removing the memory chip at the factory is next to impossible since it is a surface mount device on a multilayer board.
The coefficients calculated by the PC are transferred to the AVR so the DSP can go about the work it was designed to do. The PC to AVR interface also transfers test tones produced by the speaker during calibration. Newer generations of AVRs (hardware retrofit of a current product being extremely unlikely and expensive) with more powerful DSPs, allow more complex filters to be synthesized. For example, the number of frequency bands can be increased with an IIR filter structure. While the change in the software for Step 2 could be extensive, the interface from the PC to the AVR, to properly load the extended vector of coefficients to the DSP, would be minor.
More of a concern to the designer than the consumer is the fact that the code from the PC can work in many different brands of DSPs. Often a designer will select a board from an independent vendor which contains a complete DSP system. The board contains the DSPs, associated RAM, electrically programmable ROM (EPROM), and clocking systems. In addition the board contains chips to reformat the signals emerging from the DSP to interface to the DACs. It has chips to decode S/PDIF and other digital data formats such as the digital audio output of an HDMI receiver chip. The board will also contain a control port with a messaging system that may include the ability to reconfigure EPROM data which is required if the filter coefficients are to be loaded from the PC. Different products may use different vendors’ boards and vendors may be changed for a new design. If a company does not have the resources to design its own PC based room correction system, it must fall back to whatever simple system the vendor offers as a firmware option.
While information on these types of modules is almost never presented in a public website, examples from Momentum Data System can be found at http://www.mds.com/categories/audio-avr-products
Anthem does not use these predesigned boards in its Pre/Pros, but instead the Anthem boards are designed in-house. The MRX units use 3rd party DSP boards but not from Momentum Data Systems.
The take away here is that the important intellectual property of the ARC system is the program on the PC. Bug fixes and improvements in the ARC are completely independent of the hardware. This decoupling from hardware allows the Anthem room correction developers to produce one PC program for all products freeing up valuable resources that would be devoted to designing different code for different models.
And Now . . . The ARC Review
I am not going to discuss the basic operation of the ARC panels and the basic measurement procedures at this point in the review. Some of this was covered in the other SECRETS reviews of Anthem products with the ARC system. Refer to the review of the Anthem MRX 700-7.1 AV Receiver, by Robert Kozel, Senior Editor, for example. The value add for this review is to determine if ARC delivers on what the PC display predicts by performing independent electrical and acoustical measurements.
The verification divides into three sections:
- System Performance for Full-range Speakers
- Subwoofer Augmented Performance
- Use of the Advanced Options
I was given access to the Anthem D2 for this review. While the video cards have been changed for the current top of the line Anthem Pre/Pros, the analog sections are unchanged from what I tested. The Anthem Pro/Pros are designed and built in Canada. The look and feel of the D2 was more like expensive laboratory test equipment than consumer audio products. The internal construction was also at the standards of advanced test equipment.
The size of the filter bank is reduced in the Anthem MRX AVRs. The ARC PC software detects the maximum size of the filter it can construct and transfers the appropriate amount of coefficients to the MRX components. The Anthem ARC post EQ display, when the MRX is connected, is calculated using what will be the electrical room correction curve synthesized with the smaller filter bank.
Since the measurement system is identical for all Anthem models, Anthem engineers were able to convert measurement sets that I sent them so the corrected room frequency response plots represented the performance of the MRX device. I could then see how the performance was changed with a MRX AVR. The system still performs well in the MRX implementation.
The bulk of this review presents the actual performance of the ARC in one room, but I made measurements in three rooms. I had available main or satellite speakers from AR (a long discontinued Ken Kantor design), Infinity, KEF, Monitor Audio, NHT, Phase Technology, and Pioneer. Obviously, only a subset of these speakers was used in each room. The 3-way eight-order DSP based crossovers of the NHT speaker (model Xd) present a significant challenge since very high order filters are used, introducing significant group delay. Despite this hurdle, ARC preformed identically to the other tested speakers.
I also had subwoofers from two manufacturers (NHT and Sherwood). Note that I used no speakers from Paradigm. I have found some room EQs work best with speakers that come from the same company This is the reason I utilized numerous speakers and rooms to get a sense of the robustness of the EQ system, and it turned out to be very robust. Indeed I never saw any sign of the system failing to produce a good solution for correcting the room and speaker aberrations.
Obviously, you can create a condition that is impossible for any room correction system to correct. Under such conditions, the uncorrected system could hardly be characterized as a listenable audio system. ARC may issue a warning message during the microphone measurement process that the room response is not sufficiently accurate to correct. If the problem is speaker or seat placement, the ARC Quick Measurer tool can help you quickly find better placements.
The room’s acoustic response was captured using my independent acoustical measurement system. This is the Acoustisoft RPlusD measurement system (www.acoustisoft.com). Having used Acoustisoft products for more than ten years, I have confidence in their accuracy, especially when averaging large data sets. My microphone is from IBF-Acoustic and it is recalibrated to a reference microphone every few years.
In using the ARC, I made nine measurements with the ARC microphone by placing the microphone around the perimeter of an 18-inch square to yield eight points. The ninth point was the center of the square. I then proceeded to make my measurements with the RplusD software. I placed my microphone in the same position as the ARC microphone and captured a response curve. I then moved my microphone to the next spot I had placed the ARC microphone and captured another response. I continued this process until I made nine coincident measurements, then averaged the results. Since the microphones were moved in space, this is referred to as a spatial average. ARC requires a minimum of 5 different placements of the microphone and allows up 10.
Some are going to criticize me for only using frequency domain analysis. The importance of time domain correction is controversial and the subject of current research. It is important to separate the time domain response of the speaker, which is not directly related to the speaker frequency response (technically this is called a non-minimum phase system), from the room response. The Anthem room correction system does not attempt to try to equalize the speaker to produce a linear phase post equalized response. Some electronic room equalizers will do this, although not at low frequencies. For example the Trinnov room equalizer as implemented in the Sherwood R-972 does time equalization.
Room response variations are minimum phase with a few exceptions, unlike a speaker, and the frequency and time domain response are directly related. Again significant research has been addressed to the validity of this statement and its implications for electrical room equalizers. A summary at the layman’s level can be found in the text by Dr. Toole (Sound Reproduction, Loudspeakers and Room, Focal Press, 2008; chapters 12 and 13).
For those with the Toole text, it is best to carefully review the sections on waterfall and other time-domain graphics. The text clearly indicates that the parameters required to produce a plot with usable data are often not well understood (Section 13.5). Proper setup and interpretation of waterfall and similar plots are especially difficult to run and interpret. Some measurement tools designed for consumer use make very nice looking plots but do not provide the user with the ability to set up the measurement correctly. When using such tools, it is possible to convince oneself that large changes in the time domain can occur with no visible change in a properly set up frequency domain plot.
I spatially averaged over nine points to reduce noise in the curves and allow the smoothing of the curve to be reduced. I used 0.1 octave smoothing for these curves. 0.1 octave smoothing is more revealing in both the response variation of the speaker and the ability of the room EQ to squelch the variation than the more typical value is 0.33 octave smoothing. The ARC displays appear to be at a 1/6 (0.17) octave smoothing.
I also examined the accuracy of the frequency response display shown on the PC display of the ARC software. With an accurate display, one need not deploy an external room measurement system to observe the response before room correction. However, the post-correction plots will be optimistic since they are derived from the pre-correction measurement set as distinct from new acoustic measurements with the room equalizer in the circuit.
The post-correction display is generated by combining the pre-correction measured data and the electrical filter response curve that the Anthem hardware will produce as the signal travels into the device, through the DSP filter, and finally out the power amp (preamp out) terminals. Using the measured data, the parameters for the correction filter are generated by the proprietary ARC signal processing algorithms. Given the limitations on the ability of the DSP correction filter to mirror the uncorrected response, as a result of finite resources of the DSP in the AVR, the post-correction response curve is not going to be ruler flat in the speakers passband.
The ARC post correction curves do a good job of showing the accuracy of the algorithm which designs the DSP correction filter. In the formal verification section, I will also show measurements of the electrical correction that results when DSP coefficients are transferred from the PC to the Anthem D2 Pre/Pro. This reflects the DSP filters response with the ADC in front of it and the DAC at its output.
This electrical measurement is made by inserting a frequency sweep test tone into an analog input and measuring the change in response at the preamp output. I call these electrical inverse correction curves because they represent an approximate inverse of the room response above the speaker low frequency cutoff to the maximum frequency it is desired to correct.
Using the six-channel analog input, I could measure the electrical inverse correction curve of all channels except the rear channels since they have no inputs. All main channels showed the same performance.
I should note that not all AVR have ADCs on all the six channels of a multi-channel input. If the ADCs are absent, room correction cannot be applied to those analog channels. You must supply a multi-channel digital input, which for the consumer is via HDMI.
Below is the a screen shot of one frequency response curve shown on the PC with the ARC software running. The bottom curve shows that the scaling in the horizontal and vertical direction of the ARC PC frequency response curves can be changed.

One simply places the mouse at the starting point you want to window, and holds the right button down. The mouse then is moved over the section you want to expand. Finally releasing the right bottom yields the zoomed in graph. The Auto Scale button on the top menu restores the graphs to the original X and Y axis.
I used the zoom function for all screen shotss of the ARC display below. The ARC frequency response plots in the next section were windowed so as to match the independent acoustical measurements.
While I am showing the ARC display for one channel as a minimum, it will show two plots for a stereo setup, and it will show all eight plots for a 7.1 system.
Verification of the ARC System’s Performance with the Infinity C336 Speaker in the Large Room
Finally, this review turns to measurements of full-range speakers before and after ARC room correction. In this section, I verified the ARC’s performance with the Infinity C336 full-range speakers. The results for the C336 appear here, so it is possible to compare results with my review of the HK 990 on this site and the Sherwood R972 with Trinnov printed in the Boston Audio Society Journal Speaker (BASS v33 n2).
I have similar measurement sets for all the speakers discussed above in the three differently sized rooms (only a select set of speakers was placed in the different rooms).
Using my independent acoustical measurement system, I quantified the accuracy of the response after electronic equalization. I used 0.1 octave smoothing and a 21dB maximum amplitude scale so as to not hide performance imperfections.
The target configuration panel for this set of measurements is shown below.

While I would like to skip any discussion of the Target Configuration panel until later in this review, I am forced to bring it up now since the settings change the measurements below. The white space cuts out a section of the control panel containing text that supplies some information to the user setting the panel.
In this measurement set, I wanted to see the ARC system flattening the uncorrected response over the full range of frequencies. I set the Max EQ frequency to 5 kHz (the recommended value by Anthem). More on using Max EQ is found at the end of this first part of the review. When the Max EQ frequency is reduced, the reference level offset may need to be adjusted. As can be seen from the panel, it is at 0dB (no offset) for this measurement set.
The Room Gain, another advanced setting discussed below, was set to yield a flat response over the full range of correction The low-frequency response cutoff was also set to flat.
In flat mode, ARC attempts to hold the bottom end as at a constant gain. ARC does not try to make the woofer flat to 20Hz, but instead will increase the level by up to 6dB above the unity gain value. You will see the 6dB boost in the electrical inverse correction curves below. This works well for sealed boxes for which the maximum cone deflection declines with decreasing frequency before cutoff.
For ported systems, the cone displacement can increase below cutoff. Depending on the tuning of the speaker port, the 6dB boost may have a positive (slight decrease in low frequency extension without significant increase in distortion) or negative effect (cone displacement increases below cutoff, resulting in little useable extension and increased distortion in the area at which the boost is applied). The Infinity C336 is a ported system.
Unfortunately, ARC does not provide a method to measure the distortion of the speaker pre- or post-correction. This measurement is difficult to make at the listening seat. See my NHT B10d subwoofer review for more details on problems with distortion measurements of a woofer in your listening room. Advanced parameters allow the roll-off frequency to be set so no boost is introduced by ARC.
Measured Results
Measured results position 1
The curve set below show the frequency response curves before and after the ARC room correction is applied.

The upper curve is my acoustical measurements of the speaker from the listening seat with ARC off (ARC Out of the system). As discussed above, I made nine spatial separated measurements with my test microphone positioned coincidentally with the ARC microphone before and after the ARC room equalizer was activated, and then averaged them. The uncorrected response is +/- 5dB. Most of this response error is room related and is not an accurate representation of the speakers anechoic response characteristics. To see the speaker’s excellent intrinsic performance, you need a copy of my Infinity C336 review, published in the November 2010 on the digital AudioXpress magazine. It is currently viewable only with a digital subscription.
The bottom curve is with ARC enabled (ARC In the system). The corrected response from the speaker low frequency cutoff to 5 kHz is ± 2dB. The overall result is very impressive. Most room EQs performance degrades with decreasing frequency, but not with ARC.
I repeat that the graphs are smoothed to 0.1 octave and the curves have a compact span of 21dB. Both of these settings magnify frequency response errors in comparison to curves more frequently seen in magazines with a 40dB span and 0.33 octave smoothing.
Generation of a single pre-equalization response curves form individual microphone measurements
Below is a pair of graphs showing the pre- and post-equalized results for the nine individual measurements (nine points around an 18 inch square and its center).

Here, the nine measurements with my test microphone positioned coincidentaly with the ARC microphone before and after the ARC room equalizer were activated. The average of these curves was shown on the previous pair of graphs. As expected, the individual curves are noisy and it is impossible to trace a single curve in this composite display. At this juncture, I ask whether the post-corrected response exhibits unexpected behavior in any of the individual corrected curves.
The nine measurements receive the same correction because only a single electrical correction is applied at each microphone position. The spread of amplitude in the set of independent curves at a given frequency varies significantly, as can be seen in the pre-equalized curve set. The peak at 80Hz has a very low spread. The spread is larger in the 150 – 200Hz range, then narrows as the frequency rises above 500Hz. The same thing happens in the post-corrected curve. The average shape of the curve is flatter across the frequency range, but at any one frequency, the spread is static. This is to be expected, given a single electrical correction curve generated form the single DSP filter.
The ARC uses a simple average of the nine point spatial average and the pre-equalized response is flatter at some positions. Post-equalization, the center of the nine point average will yield the flattest response. Since I took the measurement set around the center of a single seat, the listener in this position will hear the optimal improvement.
I should note that the first placement of the ARC microphone is used to calculate the level offsets of each speaker, so it should be at the prime listening seat. The first microphone position is also an in-room frequency response measurement position just like subsequent positions.
ARC does not calculate distances between the speaker and microphone. These need to be manually entered using the on screen display of an Anthem AVR or Pre/Pro. This is the one downside of the USB microphone. It is not possible to accurately estimate the delay from the ADC and USB encoder in the microphone, and the USB decoder in the computer. If an analog microphone and preamp were connected to one side of a stereo USB sound card locally at the computer, then the other channel could be used as loopback for a timing reference.
I see a major upside in placing the entire analog signal processing inside the microphone, and little downside in having to use a tape measure, especially since some room EQs appear to make significant errors in the automatic distance measurement. Trinnov (at much higher prices now) is a special case in which accurate distance measurement in three dimensions is essential to its operation. The four microphone array needed to do this requires the use of analog transfer to four local ADCs. As a result of its special requirements, the Trinnov system can make only one measurement, and thus cannot do spatial averaging discussed above.
It is not necessary to simply average the curves in the pre-equalized plots. Some may be given more weight than others. This will produce a different electrical correction curve. With a weighted average, no post-equalized curve will have the flattest response. This is how the Audyssey system works. By shaping the post-equalized average response curve, no single position provides the flattest response. Instead, an attempt is made for the response at each microphone position to have a similar frequency response deviation. All are now suboptimal, but less variation will be seen at each microphone position (see my review of the Audyssey Professional Sound Equalizer in the November 2007 issue of Sensible Sound).
Only the correction curve shape has been changed by the non-linear weighting. The spread at any given frequency pre and post-equalized is the same. It is impossible to have a different spread because the sound captured by the microphone is sent through a single electrical equalizer. The electronics have no knowledge of the microphone’s position, and therefore supply the same correction regardless of position. The equalizer is a single-input / single-output system.
To reduce variation seat to seat in a home theater application, properly placed, multiple subwoofers would provide a more optimal result, in the range of the subwoofer, than any single-input / single-output electrical correction system can provide. Above the subwoofer crossover, passive room equalization can also improve the situation, although it is expensive for lower frequency room response improvement.
I have a strong preference for a linear weighting, as used in the ARC system, that provides approximately optimal results at one seat even when the multiple seats are in the room. If the seats are symmetrical around the primary seat, measurements can simple be made at each seat. If the speakers are not symmetrical around the listening seat, and you desire to have optimal correction to be focused on the primary seat, extra measurements could be made around that seat. This in effect allows you to determine the weighting preference for a preferred seat.
ARC allows for two different microphone measurements to be stored. The memory settings are called Cinema and Music, but these are just generic legacy names. You could, for example, use one memory to hold measurements taken just around the prime listening seat (the method I used in this review), while the other set holds measurements over a wider set of seats in the room but still with the primary goal of listening to music.
The Cinema and Music memory settings have many applications that are beyond the scope of this section. Many do not require any additional set of microphone measurements. Each memory setting allows for almost all basic and advanced control parameters to be adjusted independently. The ARC PC display allows you to view all the speakers’ frequency response characteristics as measured and after correction, with all advanced modes selected for each memory setting independently in a separate window.
The electrical inverse response curve
In the curve set below I added a third curve (the center of the set), which is the electrical response of the room equalizer measured from the six-channel analog input left channel to the six-channel analog output left channel. The electrical correction curve should be the inverse of the pre-equalized acoustic response. If it has this shape, then the post-equalized average response should be flat. The nine point averaged acoustic measurements (top and bottom curves) made with my equipment are identical to what was presented above.

The electrical inverse correction curve (center curve above) cannot respond to every wiggle in the pre-equalized response. Its response is limited by how many computations can be made in real time by the DSP which generates the electrical transfer response. Attempts to fill large dips in the uncorrected room response will not be attempted since trying to put energy into a room null will not be effective.
Trying to correct each wiggle would also be a futile exercise. As we saw in the set of individual curves, the variation in amplitude between microphone positions at any single frequency is larger than the wiggles in the post-corrected average curve.
The area on the electrical inverse correction curve that has a red circle over it shows the area that the ARC is trying to extend the lower frequency response of the speaker. Note the 6dB limit at 30Hz. Unfortunately a boost at 30Hz will produce no positive result, given that the pre-equalized response shows the speaker has no useful response, in this large room, below 40Hz. Any negative effect would have to be identified by doing pre and post EQ IM distortion measurements.
The three curves are text book examples of how an electrical room correction should work. This is the best result I have seen. It all comes down the how well the electrical inverse correction curve shape can remove the response variations in the pre-corrected curve. Producing an optimal electrical inverse correction curve is dependent on the algorithms used to create the filter from the data provided from the acoustical measurement and limitations of the filter size which is restricted by room available in the DSP chip. It is impossible for you to understand the depth of the intellectual property Anthem has amassed over the years of this system’s development to produce this result, not just for this example but with other speakers in different sized rooms.
In the curve set below, a copy of Anthem’s ARC PC display (bottom) joins the pre – and post-acoustic averaged curves I measured independently at the top and center respectively. The red curve is the pre-equalized curve, and the green is the system’s estimate of the post-equalized response. The ARC graph appears to be smoothed to approximately a sixth octave instead of the 0.1 octave smoothing used in my measurements. I cropped and scaled the ARC plot to match my graphs.

The ARC red curve is close to my independent pre-equalized measurement. The green post-equalized curve is optimistic. This is a limitation of generating the green curve without making another measurement with the microphone with the DSP coefficients loaded in the AVR. As stated above, the green curve is unlike the independent measurements I made with my acoustic measurement system with the complete room correction system operational in the AVR’s hardware. Here, the Anthem ARC combines the response of the DSP filter that it has generated from the in-room measurements with the measurements themselves.
The ARC algorithm is trying to create the flattest curve with the EQ in the system by creating an electrical curve that is the inverse of its measurements. Note, while optimistic, the green curve is not a ruler; the electrical inverse correction curve is limited in its ability to fill each peak and dip. That is reflected in the green curve. If you use the ARC’s window function to narrow the size of the vertical axis, the correction errors become more apparent. The 1/6 octave smoothing also helps to make the errors more apparent.
Note the small perturbation in the green curve, in the 1 – 2.5kHz area, that can be correlated with similar small errors in the middle curve, which is the independent acoustic measurement of the post corrected room response.
When the red curve is above the green curve, the electrical inverse correction curve attenuates the signal. When green is above red, the electrical inverse correction curve is boosting the signal. You can see the correspondence in the electrical inverse correction curve of the previous curve set (center graph).
When the green curve shows significant deviation it is a sign the speaker and listening seat are not well placed, or the anechoic response of the speaker is poor. The use of the Quick Measurer function discussed above allows you to find a more optimal seat or speaker position.
Verification of performance in position 2
Now, I repositioned the Infinity speaker. I did not attempt to mirror the placement of this speaker as one would do when placing a left and right channel in a room. Instead, I put it in a plausible position that creates a different low-frequency response.
The curve set below show the frequency response curves of the average of nine measurements I made independently before (Out) and after(In) the ARC room correction is applied with the speaker in position 2. The same microphone placement was used for measurements in the curve set above (around an 18 inch square and its center). I changed the toe-in and distance to the back wall of the Infinity C336 speaker. This explains the additional frequency response difference (top curve with the EQ out between position 1 and position 2).

Although the response curves between position 1 and 2 deviate significantly, the ARC system provides similar results. This is the key test of the ARC systems robustness. Except for one notch at 180Hz, the post-corrected response is ± 1.5dB. Part of this result is the flatter response of the pre-corrected curve. It is dominated by clustered peaks between 70Hz – 150Hz, with maximum amplitude above the average value of 9dB.
In the plot set below, I again add a third curve (center), which is the electrical inverse correction curve of the room equalizer, measured this time from the six-channel analog input right channel to the six-channel analog output right channel.

The electrical inverse correction curve (center curve above) reflects the characteristics of the acoustic curve it is trying to correct, dominated by a significant attenuation between 70 -180Hz.
Looking at the electrical inverse correction curve, we see the curve moves up 6dB in the 20Hz – 40Hz range. The speaker has almost no output in this range. As explained earlier, the ARC system tries to extend the low-frequency response of the speaker by shifting the electrical inverse correction curve. Advanced functions available in the target configuration panel can eliminate this boost.
Below, I have repeated my acoustic measurement with ARC out of the (top curve) and in the signal path (center curve). The bottom curve is the ARC PC display. Looking at the ARC red curve of the ARC PC display, we again see a graph that is close to my independent pre-equalized measurement.

The green curve is above the red, below 60Hz, which is an area that I have circled. The difference between the red and green curves is the boost in the electrical inverse correction curve shown in the previous plot set (center curve). Using the advanced configuration option called Response Cutoff, the red curve can always be set to be on or above the green curve, indicating that the boost has been removed. You do not need to measure the electrical inverse correction curve directly to see if a boost or cut is applied. Just look at the position of the red curve relative to the green curve.
I should note using the default flat Response Cutoff setting often provides the best result. Trying to keep the red curve always above the green in the low end will result in some loss of usable low end response of your speaker. It is very speaker-dependent, reflecting the distortion characteristics of the speaker below approximately 80Hz.
Verification of the Functionality of the Maximum EQ Frequency Option
This is a key feature of the ARC system. The maximum frequency at which the EQ will affect the speaker’s response is set by this parameter. It is unique among EQ systems in that the choice is user-dependent. Some systems may offer one option, typically at 300Hz, where the transition between the room’s dominated frequency response moves to the speaker’s dominated region, but ARC offers the ability to set the EQ frequency limit to any value between 200Hz and 20 kHz. Anthem sets 5 kHz as a default. This was used in all examples shown above.
In the measurements below, the Max EQ Freq was set to 1 kHz. The control panel to set the Max EQ value is below.

The reference level offset allows the amplitude of the area above the Max EQ Freq to be reduced relative to the average speaker amplitude. The reason for changing this value will be discussed in in part of the review to appear later.
In this section I want to demonstrate the feature works correctly. Recall that we saw a problem with this in the HK 990 room equalizer (Harman Kardon HK 990 Stereo Integrated Amplifier with Digital Room Correction and Dual Subwoofer Bass Management – Part I).
Below, I show a curve set with the measured acoustic response before the room correction is turned on (top curve). The electrical inverse correction curve is in the middle, and the measured acoustic response with ARC room correction enabled is at the bottom. This is the same format I used in the curve sets above that included the electrical inverse correction curves.

Limiting the maximum EQ frequency to 1kHz, the electrical inverse correction curve stops equalizing beyond 1kHz and stays at 0dB beyond 1kHz. There is a transition from equalization around 500 Hz to the 0dB reference at 1kHz. This is a smooth curve attempting to mask the sonic transition. I have highlighted, in red, the area that the electrical inverse correction curve transitions from correction to flat. In this graph, the Infinity speaker was placed in a different position of the room similar, but not identical with, the position used earlier.
As expected, the pre- and post-equalized acoustic response curves are similar above 1kHz since the electrical inverse correction curve is flat above this frequency. The orange box on the pre and post-equalized curves highlights the portion of the area that does not get corrected. Note that these measurements were made with a 0.05 octave smoothing instead of the 0.1 octave smoothing used in the curve sets above. Even with this more revealing smoothing function the corrected curve is still within ± 2dB below 1 kHz, the maximum frequency ARC is correcting. Slight differences in the curves above 1kHz are the result of slight difference in the placement of the microphone for the two measurements.
You can ignore the 16kHz peak, which is an artifact of the horizontal retrace frequency off the 13- inch NTSC TV I deployed to monitor the graphic interface from the D2 Pre/Pro.
Getting the max EQ transition correct requires complex coding. The use of the many speakers and rooms for this review helped to insure that the ARC Max EQ Frequency function is indeed very robust. A pair of additional electrical inverse correction curves with the Max EQ Frequency functional enabled, but at a different frequency, will also be shown in use in the second part of this review which looks at the performance of the ARC system when a subwoofer is added.
Using the Max EQ Frequency in conjunction with the Reference Level Offset advanced control option, makes it is possible to remove voicing (variation from flat response) from some speakers. Some companies apply voicing that was just more pleasing to the staff that was designing the product or perhaps one that will more likely move the product in the showroom.
Using the Max EQ Frequency option only works if the speaker has horizontal and vertical radiation patterns that are well behaved in an anechoic chamber. No room correction system, which can only respond to the measurements at your listening chair, can correct a speaker with poor horizontal and vertical response characteristics over the frequency range above 300Hz.
You may see a significant in-room response change around crossover points in some speakers that are flat on-axis. This is a result of significant changes in the horizontal radiation patterns between the speakers at the crossover point.
Anthem ARC was a teaching tool for me with respect to voicing. Flat was not always the best option. Attempting to remove a small voicing of as little as a 1 – 2dB made the speaker sound subjectively worse. They key take away is that Anthem ARC has the advanced algorithms that let you experiment, and since you own the PC technology, you can make adjustments in the control panels over as long of period of time as you want to take.
Room Gain
Room Gain is an option on the advanced control option in the control panel shown at the beginning of this review.
The room dominates the response of the speaker in the absence of electrical room equalization (a topic discussed in my article titled Subwoofers: A Brief Look at the Effectiveness of Using a Subwoofer in a Music System). The room gain is an increase in the average response below 200Hz relative to the mid-band response (average 300Hz -2kHz). A room has no genuine gain; a better term is preservation of pressure (term developed by Tom Nousaine as explained in my article noted above).
As you see from the measured data above, when the low end frequency response variations are reduced, the amount of bass energy in the room goes down. Some people would like some of that energy restored, finding the corrected room lacks bass post correction. The ARC Room Gain panel adjustment is designed to restore the bass energy some people believe is missing.
Some room EQs attempt to simulate the room gain by supplying a shelf to the equalization curve around 200Hz with an increase of ~2dB below 200Hz. The Anthem is much more sophisticated in that it can vary the frequency at which the shelf begins, vary the limit of the response increase below the shelf, and vary the frequency of the roll-off of the woofer. The figure below shows what happens when ARC Room Gain is applied.

In this example the “Auto Detect” function was used. With Auto Detect, ARC calculates the value of ARC Room Gain parameter to most closely match the room’s pre-correction characteristics while still maintain a smooth bass contour. Note that the Response Cutoff control option was moved from flat to 70Hz. ARC also uses this option to shape the overall bass response to match the pre-correct response. Response cutoff applies a 2nd order Butterworth filter at the frequency entered. Response Cutoff has a different function when a subwoofer is deployed as we will see in Part II of this review.
Subjectively, I am not a fan of room gain. If the goal is to reproduce what was heard at a live event, why would I want to add a bass boost that is a property of the small room I am listening in? One could call this the “we are at the event” perspective. The alternative perspective is the “performers are here in the listening room”. Perhaps this is plausible for a very small group but even a chamber orchestra has no chance of fitting into even a very large living room. The takeaway is you do not have to agree with me. ARC allows you to pick both options, and you can adjust it for something down the middle just by changing the panel settings.
Notes on High Resolution Signal Processing:
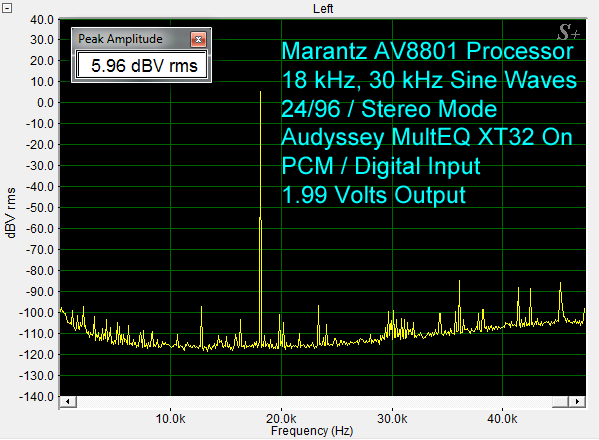
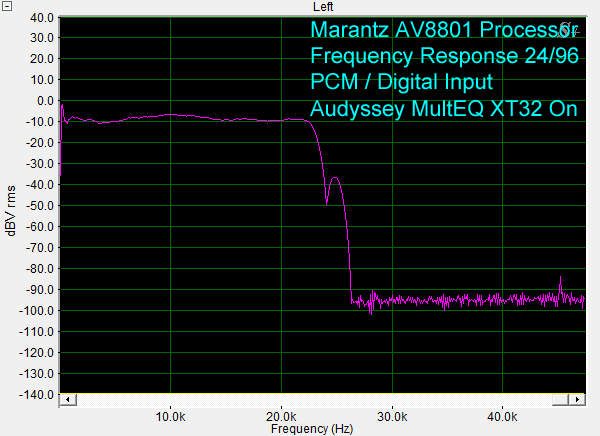
The Anthem D2 and AVM Pre/Pro products that have ARC will process an incoming signal at its native rate up to 96k samples/second. Robert Kozel verified this by using a 30kHz test signal sampled at 96k samples/sec on an Anthem D2. He did the same test with the new Marantz AV8801 Pre/Pro that has Audyssey MultEQ XT32 room correction. The AV8801 did not pass the 30kHz signal because it down-sampled the high resolution test tone to the standard resolution of 48k samples/sec. The Marantz AV8801 is $3,600 before the costs of having the unit upgraded by a Marantz certified Pro Installer using the Audyssey PC based tools and calibrated microphone. Sampling at 96k sample/sec requires twice the DSP resources for the real time filters used for room correction.
Here are graphs (all graphs shown below were produced by Robert Kozel) to illustrate that the Marantz Audyssey processing does not pass 30 kHz, which it otherwise would if digital down-sampling to 48 kHz were not occurring. The signals were 24/96, which is the maximum sampling rate that the Audyssey will accept.
First, an 18 kHz and 30 kHz set of test tones with Audyssey turned off. Note that both test tones are seen in the output.
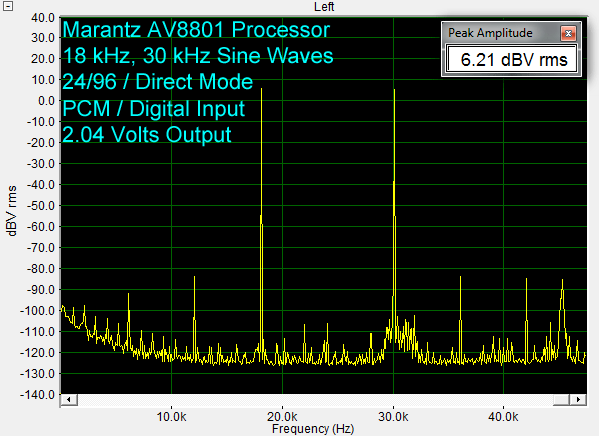
Now, a graph with the same set of test tones, but with Audyssey turned on. Note that the 30 kHz signal is no longer there. That is because the signal has been downsampled to 48 kHz, and the maximum analog frequency that can be passed through to the output is 1/2 of that, which is 24 kHz.
Further, here is the frequency response of the processor with Audyssey turned off. Note that it is reasonably flat out to 45 kHz.
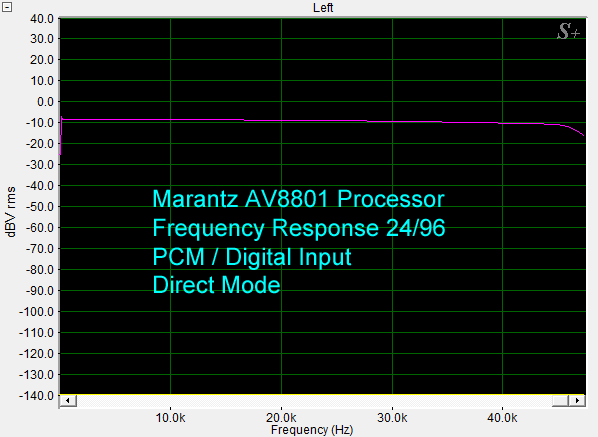
With Audyssey processing turned on, the frequency response drops off beginning at about 23 kHz, and is there is no signal beyond about 26 kHz.
The Marantz AV8801 has three 4th generation Analog Devices ADSP21487 DSPs which provides as much digital signal processing capability as found in any Pre/Pro using Audyssey MultEQ XT or XT32 room correction that I know of. I expect many and perhaps all Audyssey MultEQ XT or XT32 enabled products, including those at higher price points, will also down-sample high-resolution material to 48k samples/sec when the room correction is enabled. The Sherwood R-972 with Trinnov also down-sampled high resolution material to 48k samples/sec.
Anthem’s lower cost MRX AVRs do down-sample to 48k Samples/Sec.
Conclusions to Part I
Eventually I did enough testing that I concluded that the ARC’s red curve (acoustical room response before equalization) measurements were almost as accurate as my acoustic measurement system in producing frequency domain plots within the limitation of the 1/6 order smoothing limits of the Anthem display. One advantage of the system over my tools is that the response characteristics of up to eight speakers can be captured when making one set of measurements. The ARC system automatically moves to apply test tones to each speaker in the room. My room measurement system, which offers many more measurement functions than just the plots above, is about $600. For less than twice the price, Anthem gives you the ability to make accurate frequency response plots, provides the hardware to do the real time room correction, and tosses in a completely functional AVR.
To create an accurate post EQ curve, getting the pre-correction (red curve in the ARC PC plot) to be accurate is only a small part of the process, The algorithms that synthesize DSP filter coefficients are 90% of the engineering. How well these algorithms perform is reflected by the flatness of the independent acoustical measurements post-correction over a large set of speakers and rooms. While I am not showing all of these data, I can confirm the algorithms are robust. Again I note that no electrical room EQ system will produce results like we saw above if problems exist with the speaker’s design or the speaker or listening seat is poorly placed.
I also listened to numerous other speakers, full range, and found the result, in single presentation mono (ARC ensures matched levels in and out of the system), and stereo, to be the best I have achieved using an electrical room correction system. Obviously, my subjective observations are somewhat biased by the measured results, and it is those measurements that are, to my knowledge being presented for the first time. I refer you to other reviews on the SECRETS site, of ARC, for other subjective assessments.